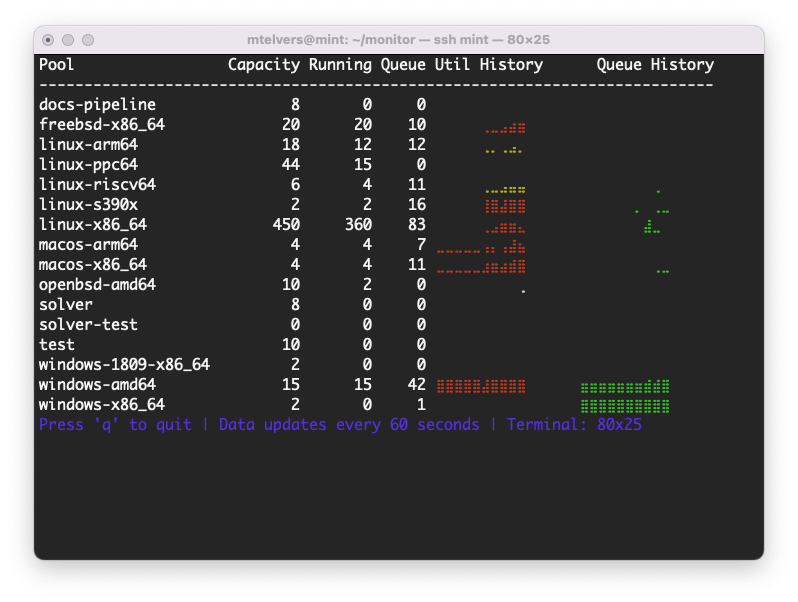
I’ve been thinking about terminal-based GUI applications recently and decided to give notty a try.
I decided to write a tool to display the status of the ocurrent/ocluster in the terminal by gathering the statistics from ocluster-admin. I want to have histograms showing each pool’s current utilisation and backlog. The histograms will resize vertically and horizontally as the terminal size changes. And yes, I do love btop.
It’s functional, but still a work in progress. mtelvers/ocluster-monitor
The histogram module uses braille characters (U+2800-U+28FF) to create dense visualizations where each character can represent up to 2x4 data points using the dots of a braille cell. In the code, these positions map to bit values:
Left Column Bits    Right Column Bits
   0x01 (1)            0x08 (4)
   0x02 (2)            0x10 (5)
   0x04 (3)            0x20 (6)
   0x40 (7)            0x80 (8)
1. Bit Mapping #
The code defines bit arrays for each column:
let left_bits = [ 0x40; 0x04; 0x02; 0x01 ]   (* Bottom to top *)
let right_bits = [ 0x80; 0x20; 0x10; 0x08 ]  (* Bottom to top *)
2. Height to Dots Conversion #
let level = int_of_float (height *. 4.0)
This converts a height value (0.0-1.0) to the number of dots to fill (0-4).
3. Dot Pattern Generation #
For each column, the algorithm:
- Iterates through the bit array from bottom to top
- Sets each bit if the current level is high enough
- Uses bitwise OR to combine all active dots
4. Character Assembly #
let braille_char = braille_base lor left_dots lor right_dots
braille_base= 0x2800 (base braille character)left_dotsandright_dotsare OR’d together- Result is converted to a Unicode character
5. Multi-Row Histograms #
For taller displays, the histogram is split into multiple rows:
- Each row represents a fraction of the total height
- Data values are normalized to fit within each row’s range
- Rows are generated from top to bottom