My gas supplier has tried and failed to install a smart gas meter, so I’ll give it a go myself.
Numerous videos on YouTube demonstrate a pipeline for capturing and processing images with AI, but this is a heavyweight solution for basic image recognition. With a fixed camera, I can compare the reference images of each digit with the current values.
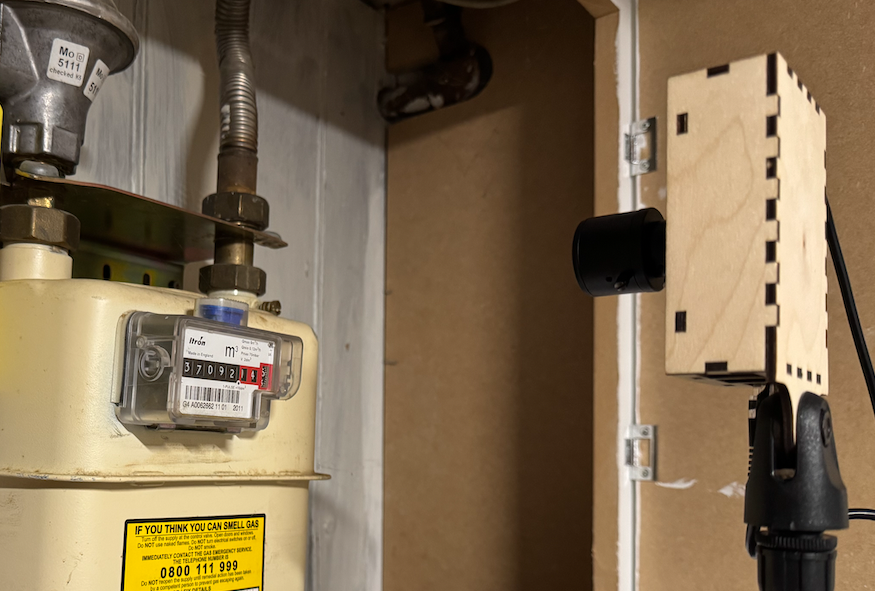
I have placed a Raspberry Pi with a camera module pointing at the gas meter.
In an ideal world, my image would be a grid of numbers with 0 = black and 255 = white.
[[  0,   0, 255, 255, 255,   0,   0  ];
 [  0, 255,   0,   0,   0, 255,   0  ];
 [  0,   0,   0,   0,   0, 255,   0  ];
 [  0,   0, 255, 255, 255,   0,   0  ];
 [  0,   0,   0,   0,   0, 255,   0  ];
 [  0, 255,   0,   0,   0, 255,   0  ];
 [  0,   0, 255, 255, 255,   0,   0  ]]
This would flatten into a 1D vector.
[ 0; 0; 255; 255; 255; 0; 0; 0; 255; 0; 0; 0; 255; 0; ...]
Then I could use the Euclidean distance to see how far apart the current image is from each of the reference images:
let euclidean_distance v1 v2 =
  Array.mapi (fun i x -> (x -. v2.(i)) ** 2.) v1
  |> Array.fold_left ( +. ) 0.0
  |> sqrt
However, as the brightness of images may vary due to reflections from the plastic housing, using the angle between the two vectors would likely be more effective. Ranging from -1 to 1, where 1 = identical.
let dot_product v1 v2 =
  Array.map2 ( *. ) v1 v2 |> Array.fold_left ( +. ) 0.0

let magnitude v =
  Array.fold_left (fun acc x -> acc +. x *. x) 0.0 v |> sqrt

let cosine_similarity v1 v2 =
  dot_product v1 v2 /. (magnitude v1 *. magnitude v2)
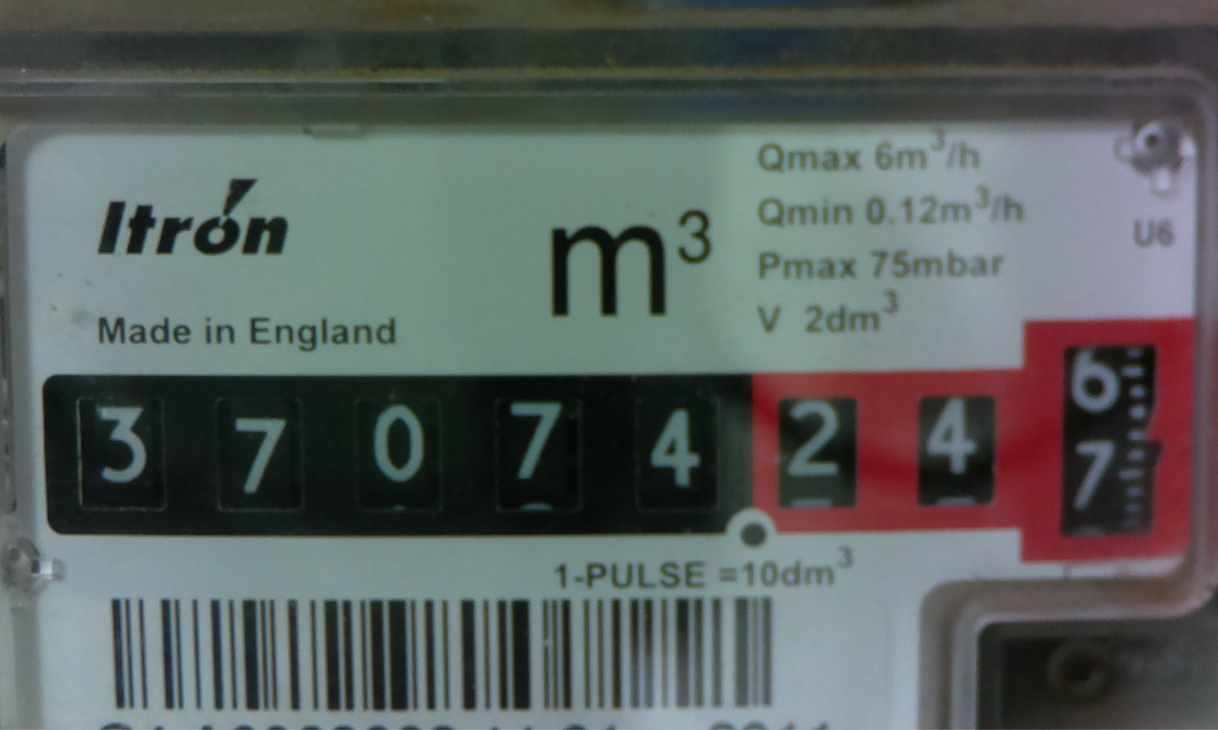
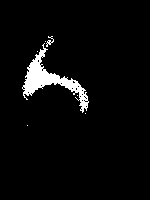
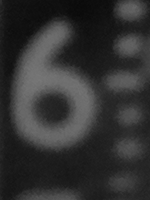
My gas meter is the kind where the digits rotate on mechanical wheels, which makes their vertical position vary over time. If I capture the basic area where the digit is, it could be near the top, near the bottom, or anywhere in between, resulting in a wide range of outcomes.
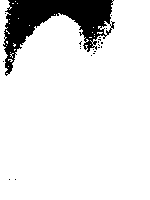
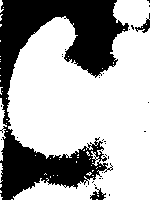
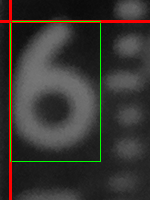
Therefore, I must first find the bounding box of the number. As the numbers are white on a black background, the simplest approach is to find the maximum and minimum brightness levels and set a threshold accordingly. I tested levels from 10% to 90% in steps of 10 and opted for 85%.


let threshold = min_v + (max_v - min_v) * 85 / 100
The bounding box can be found by searching for the first row with a bright pixel and the first column with a bright pixel:
let first_row =
  Array.find_index (fun row -> Array.exists (fun v -> v > threshold) row) arr
  |> Option.value ~default:0

let first_col =
  Array.find_mapi (fun x _ ->
    Array.find_opt (fun row -> row.(x) > threshold) arr
    |> Option.map (fun _ -> x)
  ) arr.(0) |> Option.value ~default:0
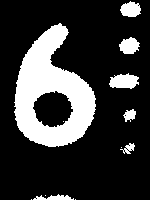
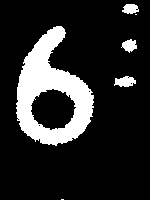
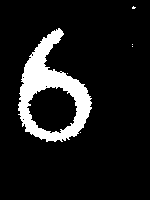
The captured image is first cropped to the area where the digit is known to appear and converted to grayscale. The 85% threshold is applied to create a two-colour image, which makes it easy to find the bounding box. The grey-scale image is then extracted for processing.

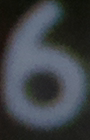
With the image extracted, calculate the cosine similarity with all the template images and sort them.
| Template | Score |
|---|---|
| 6 | 0.9260 |
| 4 | 0.8447 |
| 8 | 0.8358 |
| 0 | 0.8123 |
| 5 | 0.7764 |
| 9 | 0.7449 |
| 3 | 0.7640 |
| 1 | 0.6674 |
| 2 | 0.6623 |
| 7 | 0.6062 |
The interpretation success is perfect except for the final digit, which rotates very quickly, and the captured image is often cropped or shows multiple digits.
The code for this project is available at mtelvers/gas-meter.