In this post I look at the changes in Tessera v1.1 and validate the benchmarks in my Intel AMX post on the latest checkpoint.
What changed v1.0 to v1.1, only the bits that affect speed
Two changes affect the compute cost:
-
Internal width went from 128 to 192, and model parameters went from 45.8 M parameters to 57.7 M parameters (+26%)
-
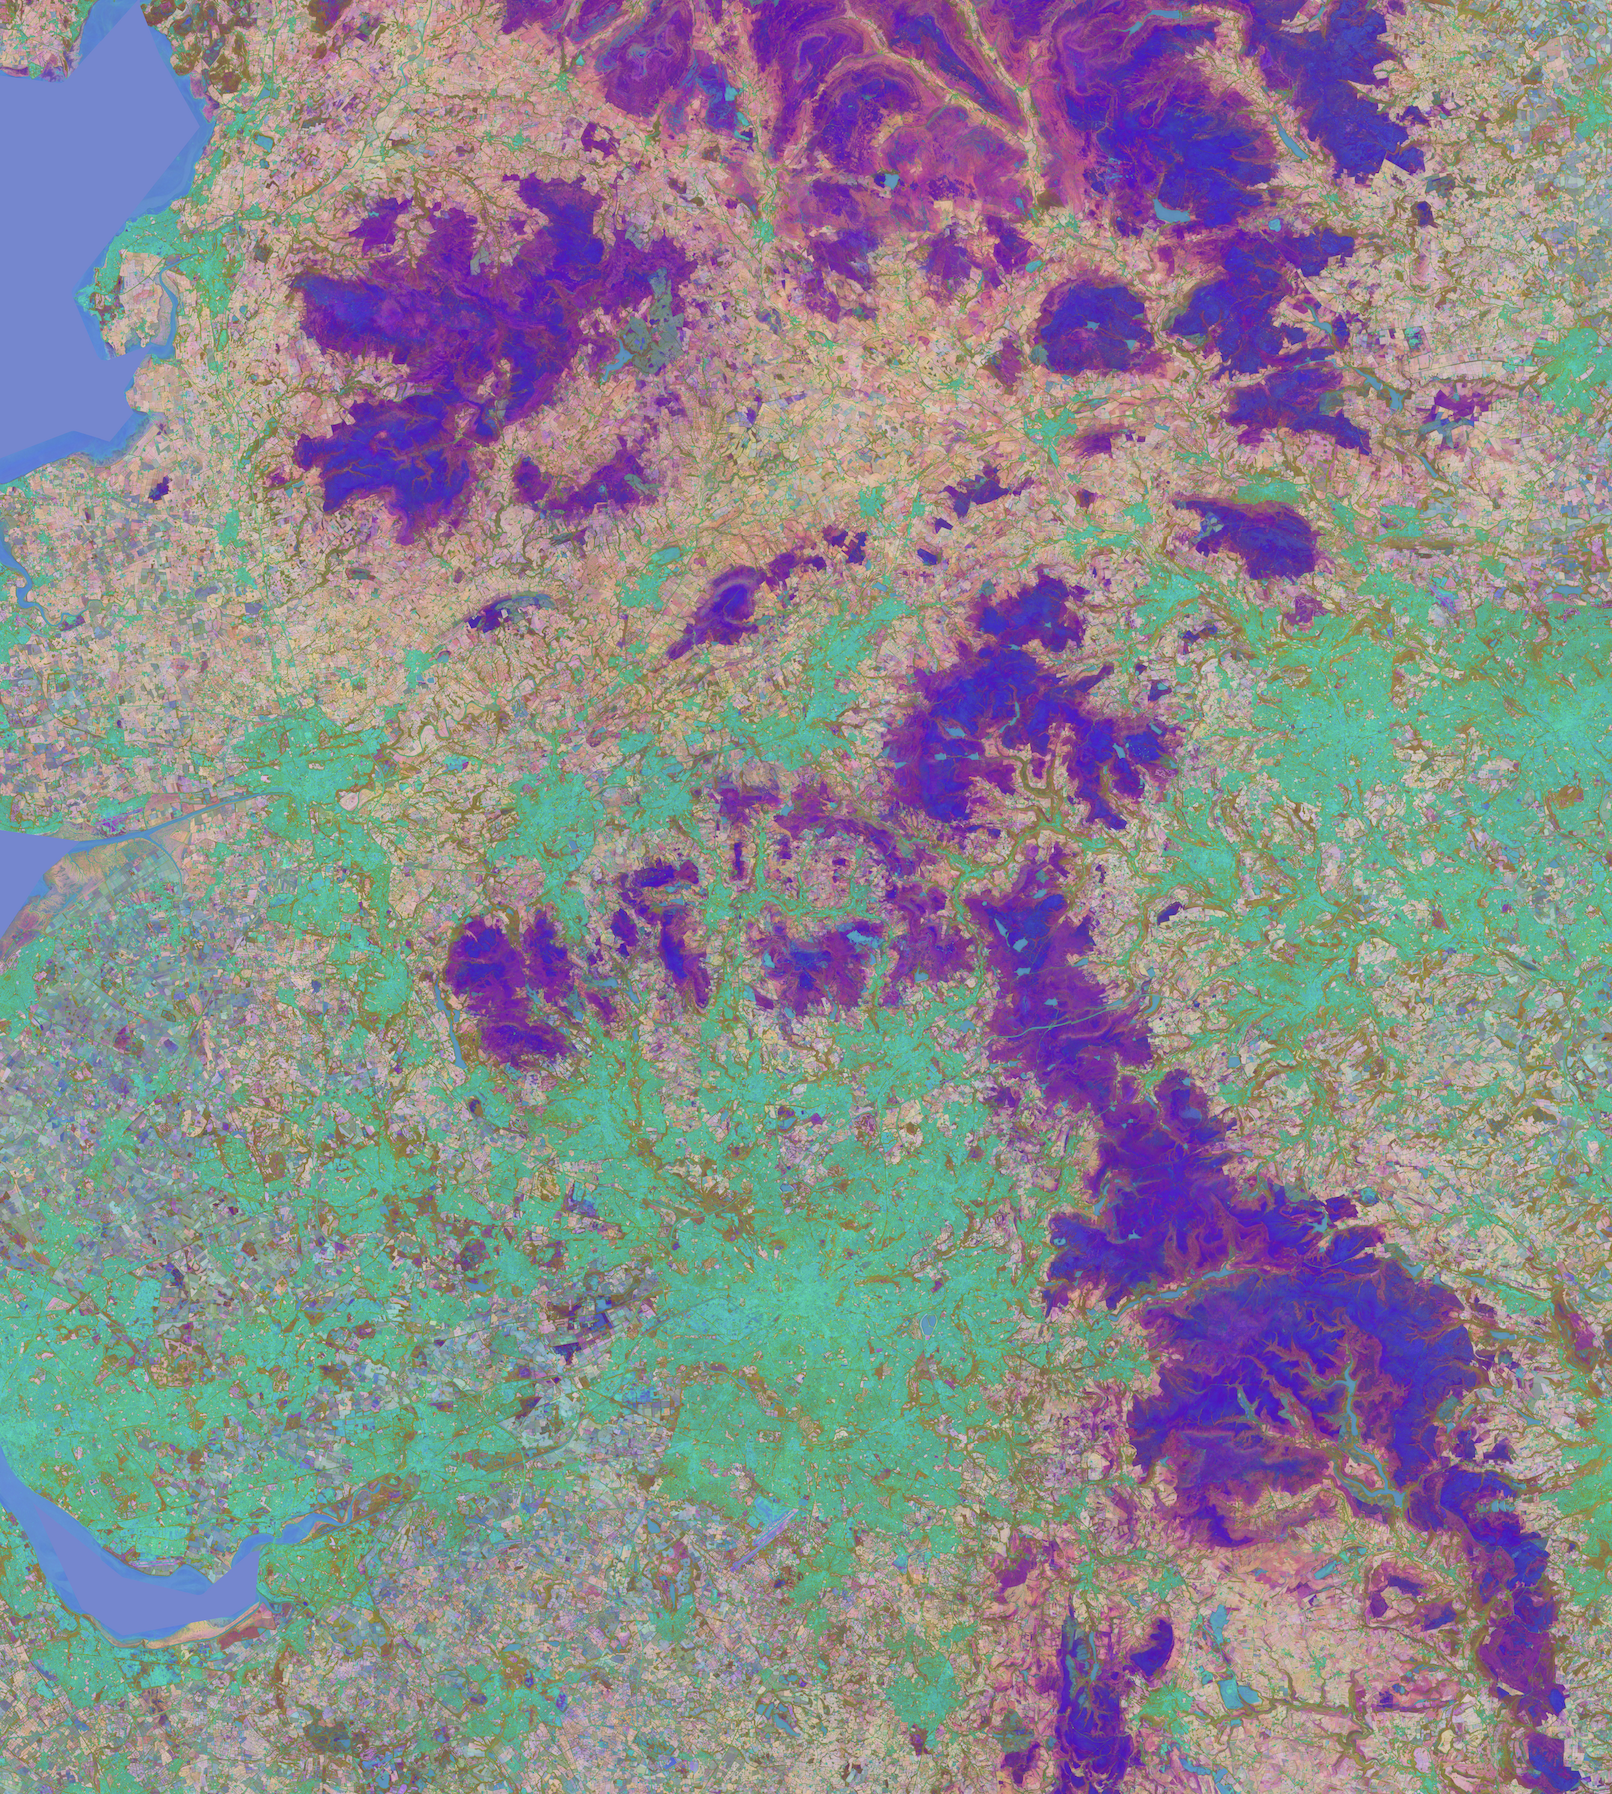
v1.0 picked exactly 40 satellite observations per pixel and ran the model on those. v1.1 keeps every valid observation. In my test tile (Manchester, 91 Sentinel-2 timesteps plus Sentinel-1 ascending and descending), the average is 68 timesteps rather than 40. x1.7
Transformer compute scales roughly linearly with the number of timesteps. Combined with the 26% larger model, v1.1 needs roughly twice as many FLOPs per pixel as v1.0, with the longer sequences accounting for most of that.
v1.1 was trained in bfloat16
v1.0 was trained in float32. v1.1 was trained directly in bfloat16, with the explicit intent that it could run on AMX-equipped CPUs (Intel’s tile-mul instructions for bf16). For comparison with v1.0 numbers, I measured both fp32 and bf16.
The benchmarks
One full Manchester tile (1126 × 690 = 776,940 pixels) on three machines:
| Hardware | v1.0 fp32 | v1.0 bf16 | v1.1 fp32 | v1.1 bf16 |
|---|---|---|---|---|
| Azure NC8as_T4_v3 (Tesla T4) | 14:31 | 19:53 | 25:45 | 33:35 |
| Local L4 (NVIDIA Ada Lovelace) | 7:21 | 2:46 | 12:15 | 4:36 |
| Azure D16s_v6 (Xeon 8573C, AMX bf16) | 41:44 | 17:31 | 1:17:58 | 26:06 |
Notes:
- bf16 helps L4 and AMX, but hurts T4. Turing-era Tensor Cores (T4) don’t accelerate bf16 well, and the precision-conversion overhead outweighs whatever benefit there is. On T4, run fp32. This was true for v1.0 and remains true for v1.1.
- v1.1 wall time is roughly 1.5-1.9x longer than v1.0 at the same precision, on every machine. That’s the 2x FLOP increase being partially absorbed by hardware that’s faster per FLOP for the larger v1.1 matrices.
- AMX bf16 on v1.1 is essentially tied with T4 fp32 (the best T4 path) at similar hourly cost: 26:06 vs 25:45. That’s the headline claim from the AMX post holding up for v1.1. A recent CPU competes with mid-tier inference GPUs at the same price. The L4 is in a different league (5.7x faster on bf16).
AMX-friendly
v1.1’s wider matrices should map better onto AMX’s 16x16 bf16 tile units, but the wall-clock numbers above show v1.1 strictly slower than v1.0 on AMX (26 min vs 17.5 min).
The architecture change is AMX-friendly. This was confirmed by running v1.1 on AMX with sampling pinned to T=40 (matching v1.0): v1.1 at T=40 finishes Manchester in 15:27, slightly faster than v1.0 at 17:31. So per timestep, the v1.1 architecture is the better fit for AMX hardware.
What costs the wall-clock time is the sampling change: keeping every valid observation pushes the average sequence length per pixel from 40 to ~68. That ~1.7x longer sequence accounts for essentially all of v1.1’s wall-clock penalty.
Global processing: 1.6 M tiles
The world at 0.1° resolution is 1,593,480 land tiles based upon the number of landmask tiles. Multiplying our per-tile times by 1.6 M and Azure list-price hourly rates:
| Path | $/hr | s/tile | total time (hr) | total cost |
|---|---|---|---|---|
| T4 v1.1 fp32 (NC8as_T4_v3) | $0.94 | 1545 | 686k | $641 k |
| AMX VM v1.1 bf16 (D16s_v6) | $0.98 | 1566 | 696k | $679 k |
| T4 v1.1 bf16 | $0.94 | 2015 | 900k | $837 k |
T4 fp32 and AMX bf16 are within 6% of each other in terms of cost. T4 bf16 performance is bad and the spot price on AMX is attractive.