Sadiq asked me to process the UK with Tessera v1.1 on Azure using the most cost-effective method.
As Tessera v1.1 uses bf16, I expected the AMX route to be the cheapest, particularly given the spot pricing for AMX CPUs on Azure down at $0.18 per hour. I measured the interference time using the v1.1 model on a predownloaded dpixel tile on AMX, T4, A10. Figures below are with pricing for “East US” region. There is regional variation, but the trend is the same.
| Path | v1.1 (Manchester tile) | Spot $/hr | $/tile |
|---|---|---|---|
NV36ads_A10_v5 Spot |
4:26 | $0.591 | $0.044 |
D16s_v6 AMX Spot |
26:06 | $0.184 | $0.080 |
NC8as_T4_v3 T4 Spot |
25:45 | $0.292 | $0.125 |
AMX is competitive, but the A10 is the clear winner both in time taken and lowest cost per tile.
The Azure quota for a specific instance type might report zero, but the spot quota is completely separate and is the only one that applies to creating spots. They aren’t related; consuming one doesn’t affect the other. The quota allocation was 350 spot vCPUs in every region. However, the presence of a quota doesn’t mean that the machine is available in that region, nor that there is capacity.
The smallest allocation is 6 vCPU, which gives you one-sixth of an A10 on a shared basis. The sharing was weird to watch in btop: the GPU ran at 90%, then dropped to 0 for 2-3 seconds, then ran again. These are unbelievably cheap at $0.084/hour, but the inference time climbed to 25:39, making it comparable with the T4 and AMX time. To get a dedicated full A10, you need to request 36 vCPUs.
The process of generating embeddings for a given tile is three-stage: download -> infer -> upload. The download stage fetches the Sentinel 1 and 2 data, which is constrained by network round-trip times and download bandwidth. The inference stage is bound by the GPU. The final upload is small, but it’s important to remember that this will generate a lot of data over time.
Running a test tile showed the timing of those three stages to be: 136s for download, 262s for inference and 7s for upload. The limiting factor will be the inference, but those GPUs need to be continuously fed with data. Having a worker machine download two (or more) tiles in parallel, and use a simple mutex on the inference stage. Two would be sufficient, but three would cover cases where the inference was quick, say, in a coastal region at high latitudes.
Up to this point, I had been manually installing all the dependencies each time I created a new VM, but that isn’t really scalable. Azure allows you to pass a custom script to configure the VM: az vm create ... --custom-data bootstrap.sh which installs the dependencies, such as CUDA drivers, and sets up the Python venv.
I had been planning to use Azure Batch as the native solution rather than ocurrent/ocluster, but neither matched the vision I had of the dashboard showing a map being filled in as tiles were processed.
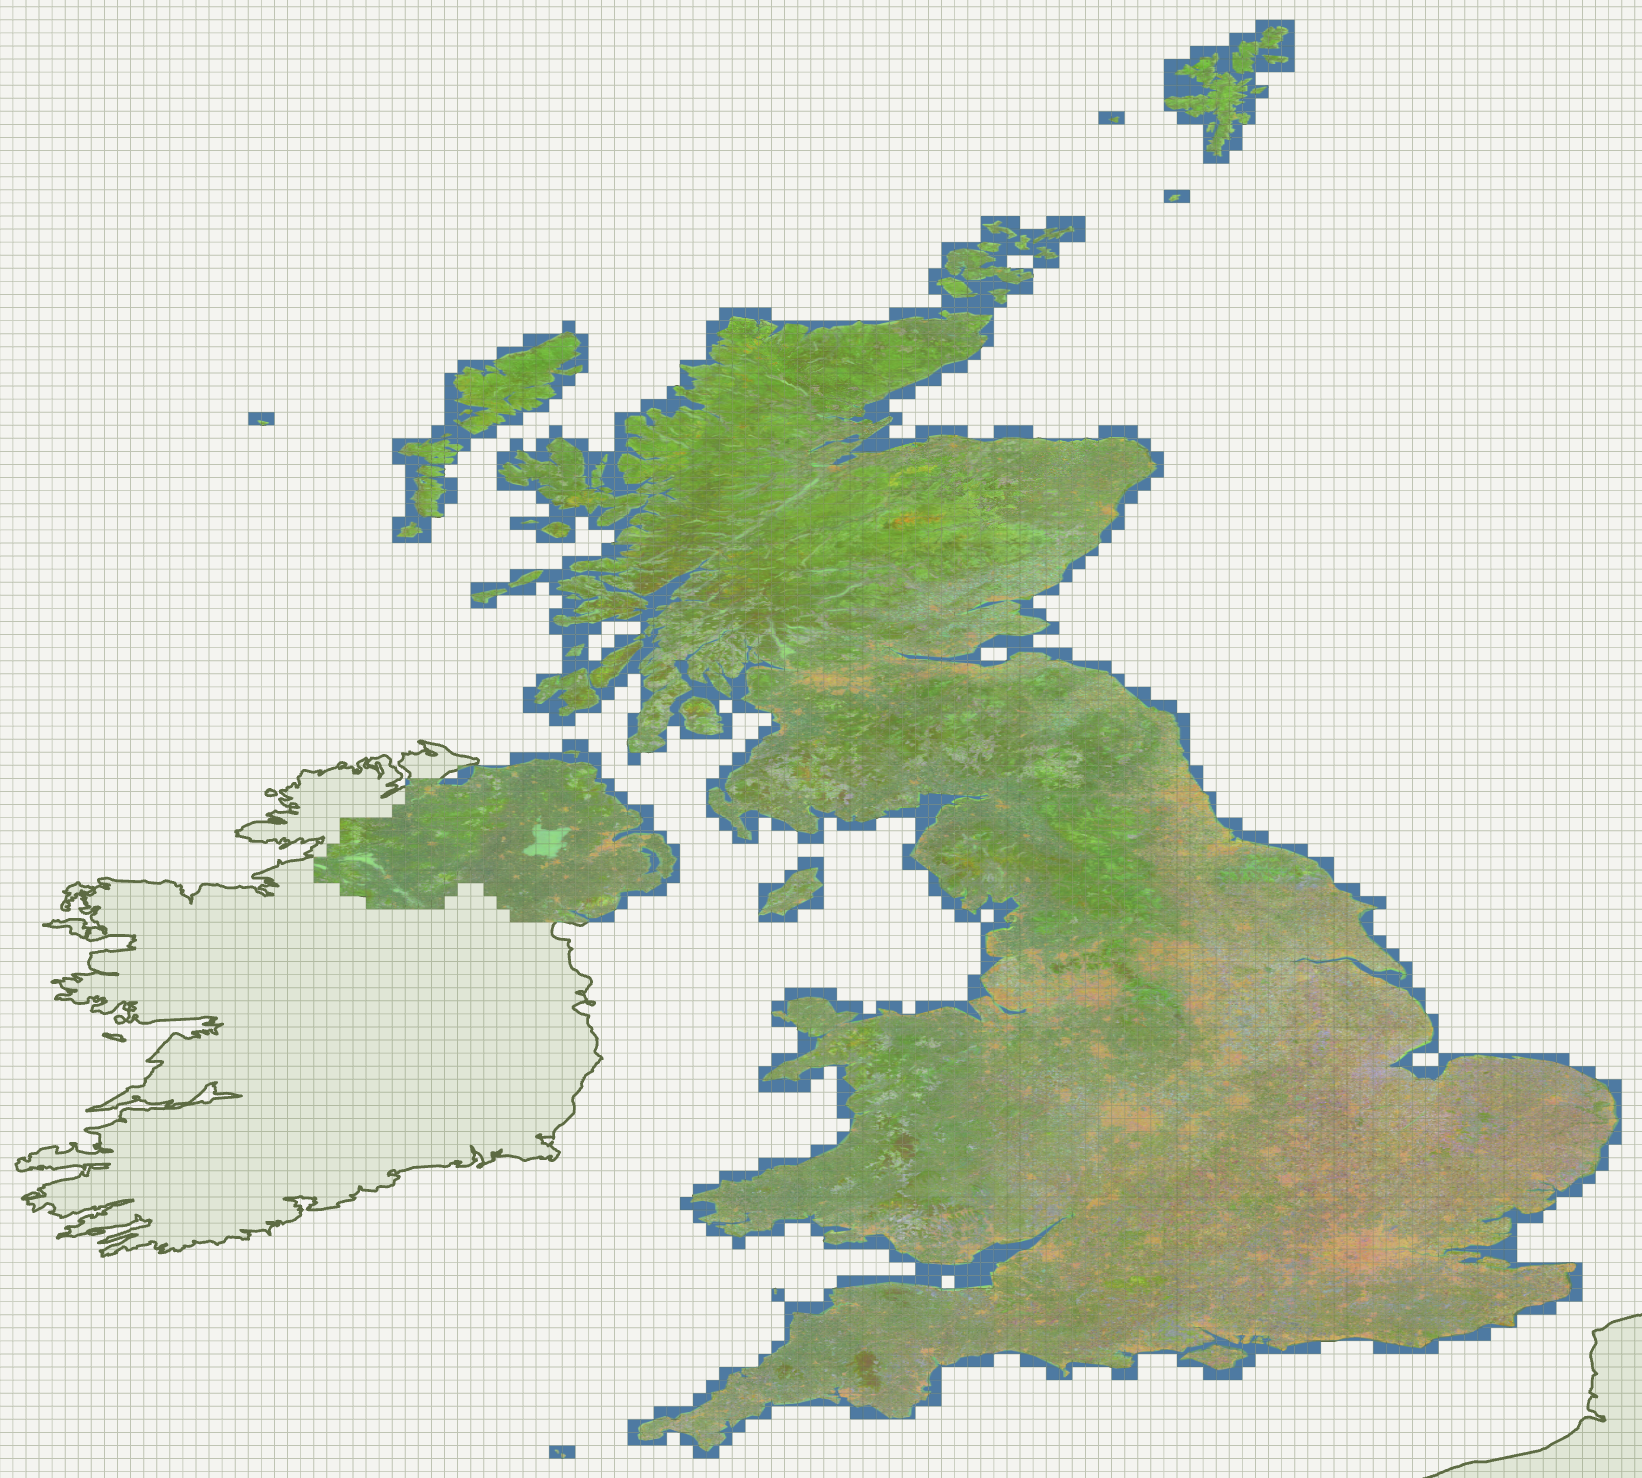
When calculating how big Europe was, I used the Natural Earth coastline shapefiles, which seemed like the perfect starting point for a web dashboard showing the 0.1-degree grid.
This grew into an orchestrator mtelvers/genesis which initially consisted of two endpoints: GET /work, which returned a <year>/<grid> to work on, and POST /result/<year>/<grid>, which accepted the resulting embedding. Later, POST /progress/<year>/<grid> was added, allowing workers to provide a single float representing their progress, which I used to colour tiles to indicate which stage they were at. Finally, POST /progress/... was expanded to accept a JSON body containing simple metrics such as the worker name and CPU/GPU load.
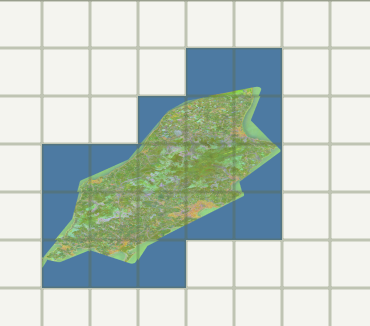
The Isle of Man is 18 tiles at 0.1 degrees, which was perfect for a small test run.
It was a useful test, as one of the worker spot instances got evicted partway through, showing that this is a real failure case that I needed to account for. Furthermore, once the machine booted back up, the 1.4TB /mnt partition, which I had been using for local storage, had been wiped. However, the system disk was retained, so the venv wasn’t lost.
I updated the orchestrator to add a timestamp to the POST /progress/... route, along with a sweeper thread that, after 30 minutes of silence, moved tiles back to the queue.
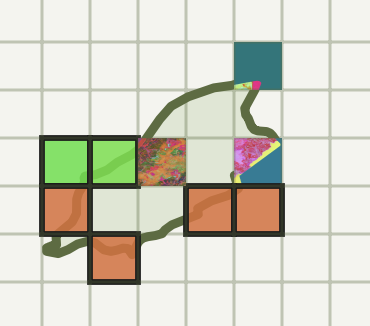
The dashboard map wasn’t as pretty as I would have liked, because the PCA was calculated per tile, so two adjacent tiles could end up quite different colours. See image. Therefore, I simplified by taking the first three embeddings as RGB, which resulted in a pleasant green for the countryside.
After the code changes, I ran the Isle of Man for a second year to check the new code paths.
Ramping up to the full UK was straightforward, run genesis ... --include-country "United Kingdom" and create as many VMs as Azure would allow. Two things came from watching a longer run.
Firstly, Azure evictions can result in the loss of many machines in an instant. I covered this with a bash script which polls the workers every couple of minutes and restarts those which are Deallocating. I wouldn’t have had that problem if I’d used Azure Batch.
Secondly, over the run, two workers developed ECC faults in the GPU DRAM. I noticed this as these workers had more than 50 jobs assigned to them, and the sweeper was collecting them as they timed out. The download phase was working perfectly, but the inference step aborted immediately. The solution here was to run az vm deallocate and let the bash script restart the VM, which had been allocated to new hardware.