Headline activities have included resolving the scraping attacks, fixing obuilder bugs, and Tessera AMX optimisations.
The scraper attack resolved with a SQL index #
The distributed botnet scraping every page on opam-repo-ci and OCaml-CI has been a continuing thread over the last few weeks. I’ve written about Caddy rate-limiting, and adding a proof-of-work challenge all of which solved the problem at that moment.
The story continued early this week as the PoW rollout had an unintended side effect, as every ocaml.ci.dev/github/<org> page started returning 503 for real users (ocurrent/ocaml-ci#1067). The challenge interstitial is deliberately served with a 503 status so clients retry once they’ve solved it, but Dream installs a catch-all error handler that funnels every 4xx/5xx response through a template, and that template unconditionally calls Dream.set_body, which overwrites the interstitial with a generic “Service Unavailable” page. Thus, browsers got a 503 with no solver JavaScript and could never pass the challenge. The fix is a sentinel X-Ocurrent-Challenge: 1 header that the error handler checks and passes the response through untouched.
With that fixed, the botnet adapted. It had solved the PoW exactly once and was replaying the single __ocurrent_pow cookie across 113 distinct IP addresses, one request each. The token is <exp>.<hmac(exp)> with a seven-day TTL bound to nothing at all, so one solve was a week-long shared bearer credential for the whole fleet. I mitigated it directly by rotating the signing key, which invalidates all outstanding cookies and forces a fresh solve, and by tightening the rate limit.
The attack stepped up a second time with a JavaScript-capable botnet that actually solves the challenge, every time, and scrapes away. At that point, proof-of-work is no longer a filter, and a distributed bot is indistinguishable from real users. I was a bit stuck. Caching didn’t feel like it would help either, because crawling every page is essentially always a cache miss, and there are nearly 3TB of logs. The requirement was to make serving the page as cheap as a cache read. The logs are plain text files on disk, so why is serving a single variant page so expensive that a couple of requests per second keep a single core at 100% utilisation?
perf on the engine answered it immediately: 96.9% of CPU was inside libsqlite3, dominated by sqlite3VdbeExec, sqlite3VdbeRecordCompareWithSkip and sqlite3BtreeNext. That wasn’t what I expected to see at all! The database was the slow part, not the log rendering or streaming (which was ~3%). That pointed towards Index.get_full_hash in lib/index.ml:
SELECT DISTINCT hash FROM ci_build_index WHERE owner = ? AND name = ? AND hash LIKE ?
The table’s primary key is (owner, name, hash, variant). EXPLAIN QUERY PLAN showed the sibling get_job/get_jobs queries seeking correctly on the PK, but get_full_hash only used the index for owner = ? AND name = ? and then scanned every row under that prefix. The reason is that in SQLite LIKE is case-insensitive by default, which disables the index for the hash term. opam-repo-ci’s ci_build_index is a single tenant so owner = 'ocaml' AND name = 'opam-repository' matches the entire table, some 4,508,582 rows, in a 6.2 GB database. Therefore, get_full_hash, which is called on every commit and variant page, scans all 4.5M rows synchronously, on the single Lwt thread. I measured ~0.97s of CPU per call; roughly one request per second is enough to saturate a core, and the rate-limited crawl was running at two to three.
The fix is two lines. Change hash LIKE ? to hash GLOB ?, and the bound pattern short_hash ^ "%" to short_hash ^ "*". GLOB is case-sensitive, so its prefix pattern compiles to an indexed range seek (hash > ? AND hash < ?). Git hashes are lowercase hex, so case-sensitivity wasn’t adding anything here anyway, and the ambiguous short-hash semantics are unchanged. Benchmarked read-only against the live production databases. OCaml-CI and opam-repo-ci have a shared heritage so these SQL queries are in both applications.
| Query | Plan | Time |
|---|---|---|
opam-repo-ci LIKE (before) |
scan 4.5M rows | 968 ms |
opam-repo-ci GLOB (after) |
index range seek | ~1 ms |
OCaml-CI LIKE (before, 271 GB DB) |
scan | 49 ms |
OCaml-CI GLOB (after) |
seek | 0.15 ms |
With the queries running about a thousand times faster, I deployed this code, turned off the emergency rate limit fully and let the crawl flow. The engine sat at 0.02–3.15% CPU where it had been at 100%. The next morning the crawl was still active (57 /variant requests a minute), and the engine was at 0.01% CPU, zero restarts, load average 0.17, and zero 502s. During the attack, it had been throwing 502s on roughly 7,800 of every 8,000 requests. The PRs are ocurrent/opam-repo-ci#482 and ocurrent/ocaml-ci#1069, and cherry-picked onto the live branches.
I wrote a small load generator that behaves like the crawler. It solves the difficulty-12 PoW challenge, takes the cookie, then ramps concurrency against real /variant URLs while sampling engine CPU:
| Concurrency | Throughput | p95 | Engine CPU |
|---|---|---|---|
| 1 | 15 rps | 90 ms | 6% |
| 4 | 68 rps | 56 ms | ~100% |
| 16 | 270 rps | 223 ms | 81% |
| 32 | 281 rps | 413 ms | ~100% |
The engine now serves about 280 variant pages per second before a core saturates. The crawl’s ~2–3 rps peak is about 1% of that. I set the three key static zones to events 50, window 1s, roughly 20% of the ceiling, ~20 times the crawl peak, comfortably above anything a real user does, and still a denial-of-service backstop. Log-fetch from the cold spinning-disk archive is the one dimension that is still not cheap, which is why I kept a backstop at all rather than removing it.
obuilder: overlayfs mount leak, and a long-standing shared-context bug #
Real builds on the linux-x86_64 farm were failing intermittently, and tracing a worker log turned up two quite different bugs. The first one was specific to exception handling in the overlayfs backend, and the other has been latent in obuilder’s shared-build handling for as long as that feature has existed, independent of which backend you run.
Unlike the success and error paths, the exception path in Overlayfs.build runs rm -rf on the merged scratch directory without unmounting it first. When the build function raises, the overlay is still mounted, so rm -rf merged fails with Device or resource busy and the mount leaks. Because merged/work are keyed only on the content-hash id and reused, each retry mounts on top of the leaked mount. Once stacked, even the success path’s single umount can no longer clean up correctly, so the store fills and that id is permanently poisoned. The fix unmounts in the exception handler before deleting. I rolled it across the whole fleet, rebooting each machine to clear the in-memory overlayfs state as it went. (ocurrent/obuilder#215)
After finding the exception bug, I looked into why exceptions were being raised in the first place. The cause was opam2web builds, but not intrinsically opam2web, it just happens to have a workload which reliably causes the failure. When two jobs de-duplicate onto a single build, the copy step reads the first caller’s build context. opam2web watches opam-repository and builds its live and staging branches, which (currently) sit at the same commit, so OCluster collapses the two into one shared build; when maintainers merge a burst of PRs, each triggers a cancel-and-restart. If the caller that owns the context is cancelled and its context tmpdir is deleted while another job is still sharing the build, the survivor’s copy fails with ENOENT and the uncancelled job fails with it. By and large, this doesn’t matter as the remaining job is seconds away from being cancelled, but it does cause the exception path on those occasions where the second job isn’t cancelled before the context is removed. The minimal reproduction job is ((copy . foo)). The more files in . the more likely the exception. Start two of them, and then cancel the first. I reproduced it as an obuilder unit test, then fixed it in db_store.ml with a small change with zero cost on the normal path. Flag the build which owns the context and have the surviving job rebuild from its own context instead of failing. Three tests cover it: a survivor finishing after the owner is cancelled mid-copy, both jobs are cancelled in turn and a cascade of three jobs. Mock_store now discards the in-progress directory when the build function raises, matching the real stores. ocurrent/obuilder#216.
opam-repository lint #
@shonfeder reported (ocurrent/opam-repo-ci#480) that opam files with CRLF line endings break opam’s incremental repository update with Internal_patch_error: does not apply cleanly. ocurrent/opam-repo-ci#481 adds a lint check rejecting them: a new ForbiddenCRLF error and a check_no_crlf that reads the raw file via open_in_bin and flags any \r\n. I wrote the cram case with sed then mv rather than git add/commit, because otherwise core.autocrlf would normalise the on-disk file and mask the very thing under test. The same PR fixes some pre-existing cram drift where --check=archive-repo cases were failing with unknown option '--check' — a newer cmdliner no longer auto-abbreviates long options, so --check became --checks in eleven places.
FreeBSD pkg race #
@edwintorok reported an intermittent FreeBSD failure (ocurrent/ocaml-ci#1068): pkg: Fail to chown /method.TlsInteraction.ask_password.html: Bad file descriptor, non-deterministic, cured by a retry. That truncated path is the tell. pkg-static extracts multi-threaded and has a race where it closes a directory fd before fchownat(), giving EBADF. It is not an obuilder or OCaml-CI bug (OCaml-CI only submits the job); it is upstream FreeBSD, exactly matching freebsd/pkg#2279.
Tessera compute: many more tiles per vCPU #
GPUs complete Tessera inference quickly and efficiently, but GPUs in Azure are in high demand, leading to a high spot eviction rate and no capacity to restart machines once they are evicted. AMX is an effective alternative to GPUs, and eviction rates are much lower. How do I get the most embedding tiles per vCPU out of the spot capacity I can get?
Firstly, I should point out that AMX is per-core, not per-thread. So in Azure parlance, a d8 machine has 8 threads over 4 physical cores and therefore 4 AMX units. Azure provisions 4GB of RAM per thread so a d8 machine gets you 32GB of RAM and a d32 machine gets you 128GB of RAM.
Early testing showed that the Tessera didn’t scale linearly, and a small configuration was better than a larger one. However, when I initially took the v1.1 pipeline and merged the multiple files to create a byte-identical, but entirely memory-resident version, I kept a bit more in memory than needed, which meant that I exceeded the 32GB of RAM in a d8 machine and even the 64GB of RAM in a d16, forcing me to use a d32.
São Paulo, grid_-46.95_-23.55 in 2023, has over 1,500 scenes across 146 dates and was my worst-case test tile. Acquiring the data per date rather than holding it all in RAM reduced the peak RSS from 143GB to 10.8GB. It was an obvious optimisation when looking for it, but the A10 GPU machines have 440GB of RAM, so there was no need to optimise! Obviously, this produces byte-identical dpixel data.
With the memory barrier gone, I could finally move the fleet onto d8 machines. From the AMX sizing work this would compute more tiles per CPU. Given 16 x AMX units, you can run the inference on more tiles by dividing them into 4 blocks of 4 and running them in parallel. 4 AMX units take about an hour to perform the inference, but 16 AMX units take ~25 minutes, so after 1 hour of run time, the large machine has inferred fewer tiles than the four smaller ones. Thus 4 x d8 wins out over 1 x d32.
This holds true at scale as well. I converted an entire regional 640 vCPU spot allocation from 20 x d32 machines into 80 x d8 machines. However, when you factor in spot evictions, the story is more nuanced. The d8 machines suffered from a higher eviction rate than d32 machines. d8 machines tended to be hit in batches, taking out 4-8 machines in a single cycle. Since the inference was slower per machine, you actually need the spot for an entire hour to get any result, so an eviction typically loses more work. This brought the two pools to parity with d8 winning whenever eviction rates allowed.
As d32 seemed to evict less, there was another angle. Run 4 concurrent d8 sized workloads on a single d32 machine, while pinning the builds to specific CPUs 0-7/8-15/16-23/24-31 giving each four whole cores and four AMX units just as it would have on the d8.
Testing in belgiumcentral went from the worst d32 region at 2.30 tiles/box/hr to leading the fleet at 3.63 tiles/box/hr, giving the d8 compute profile benefit without the d8 eviction penalty.
When a machine runs many worker processes at once (e.g. 24 workers on the 252‑core Vultr GPU boxes, or 4 workers on a d32), each worker independently spins up thread pools - OpenBLAS/numpy, GDAL/rasterio COG decompression, the dask scheduler, and torch’s intra‑op pool - and every one of those libraries defaults its pool size to the whole machine’s core count rather than the process’s fair share. The result is that each worker alone opened ~326 threads, and 24 of them together (on Vultr) produced ~3,900 threads competing for 252 cores with the load average sitting in the mid‑hundreds. Pinning each worker’s pools to a fair slice of the box: set OMP_/OPENBLAS_/MKL_/NUMEXPR_/GDAL_NUM_THREADS and DASK_NUM_WORKERS to a small value (~8) in the worker environment, and size torch to the process’s CPU affinity (len(os.sched_getaffinity(0))) rather than os.cpu_count(). Once capped, total threads stay under the core count, the load average drops to single digits, and the same work completes 10-15% faster than before.
A batch-size sweep on AMX showed the encoder is a four-layer Transformer plus a serial GRU attention-pool, and that a batch of 256 gives +9.8% over my default of 1024 for the four-thread workers. The optimal batch size depends upon the s1 and s2 counts. Using batch_size = clamp(16384/max(s2_t,s1_t), 64, 2048) seemed optimal.
Genesis: a priority queue, and driving Tanzania through it #
The mtelvers/genesis dispatch server got three related changes. First, start up ROI enumeration ran one domain per ROI, so a single huge ROI like Brazil with ~160,000 candidate cells, each point-in-polygon tested against a vast outer ring, sat on one core while the other 47 idled. Flattening every (roi, candidate) pair into a single array and running the point-in-polygon filter in one parallel pass across all cores makes enumeration time total_work / cores instead of “the biggest ROI on one core”, with identical output and dedup.
Second, when a worker machine is evicted, its in-progress cells are requeued by the staleness sweeper. They are requeued to the end of the current work queue via OCaml’s Queue.add. I added a small script to each machine, which polls the machine’s Azure event queue and gives us a 30-second notice of a pending eviction. I added a new POST /abort endpoint that requeues a dead host’s in-progress cells straight away, but re-queuing them with Queue.add put them on the back of the single FIFO. This is annoying as I typically have geotessera/issue ROIs queued ahead of large backstop regions like Brazil. I want the small ROIs to finish first. POST /abort tiles now get added to a new priority queue which gets serviced ahead of the normal queue.
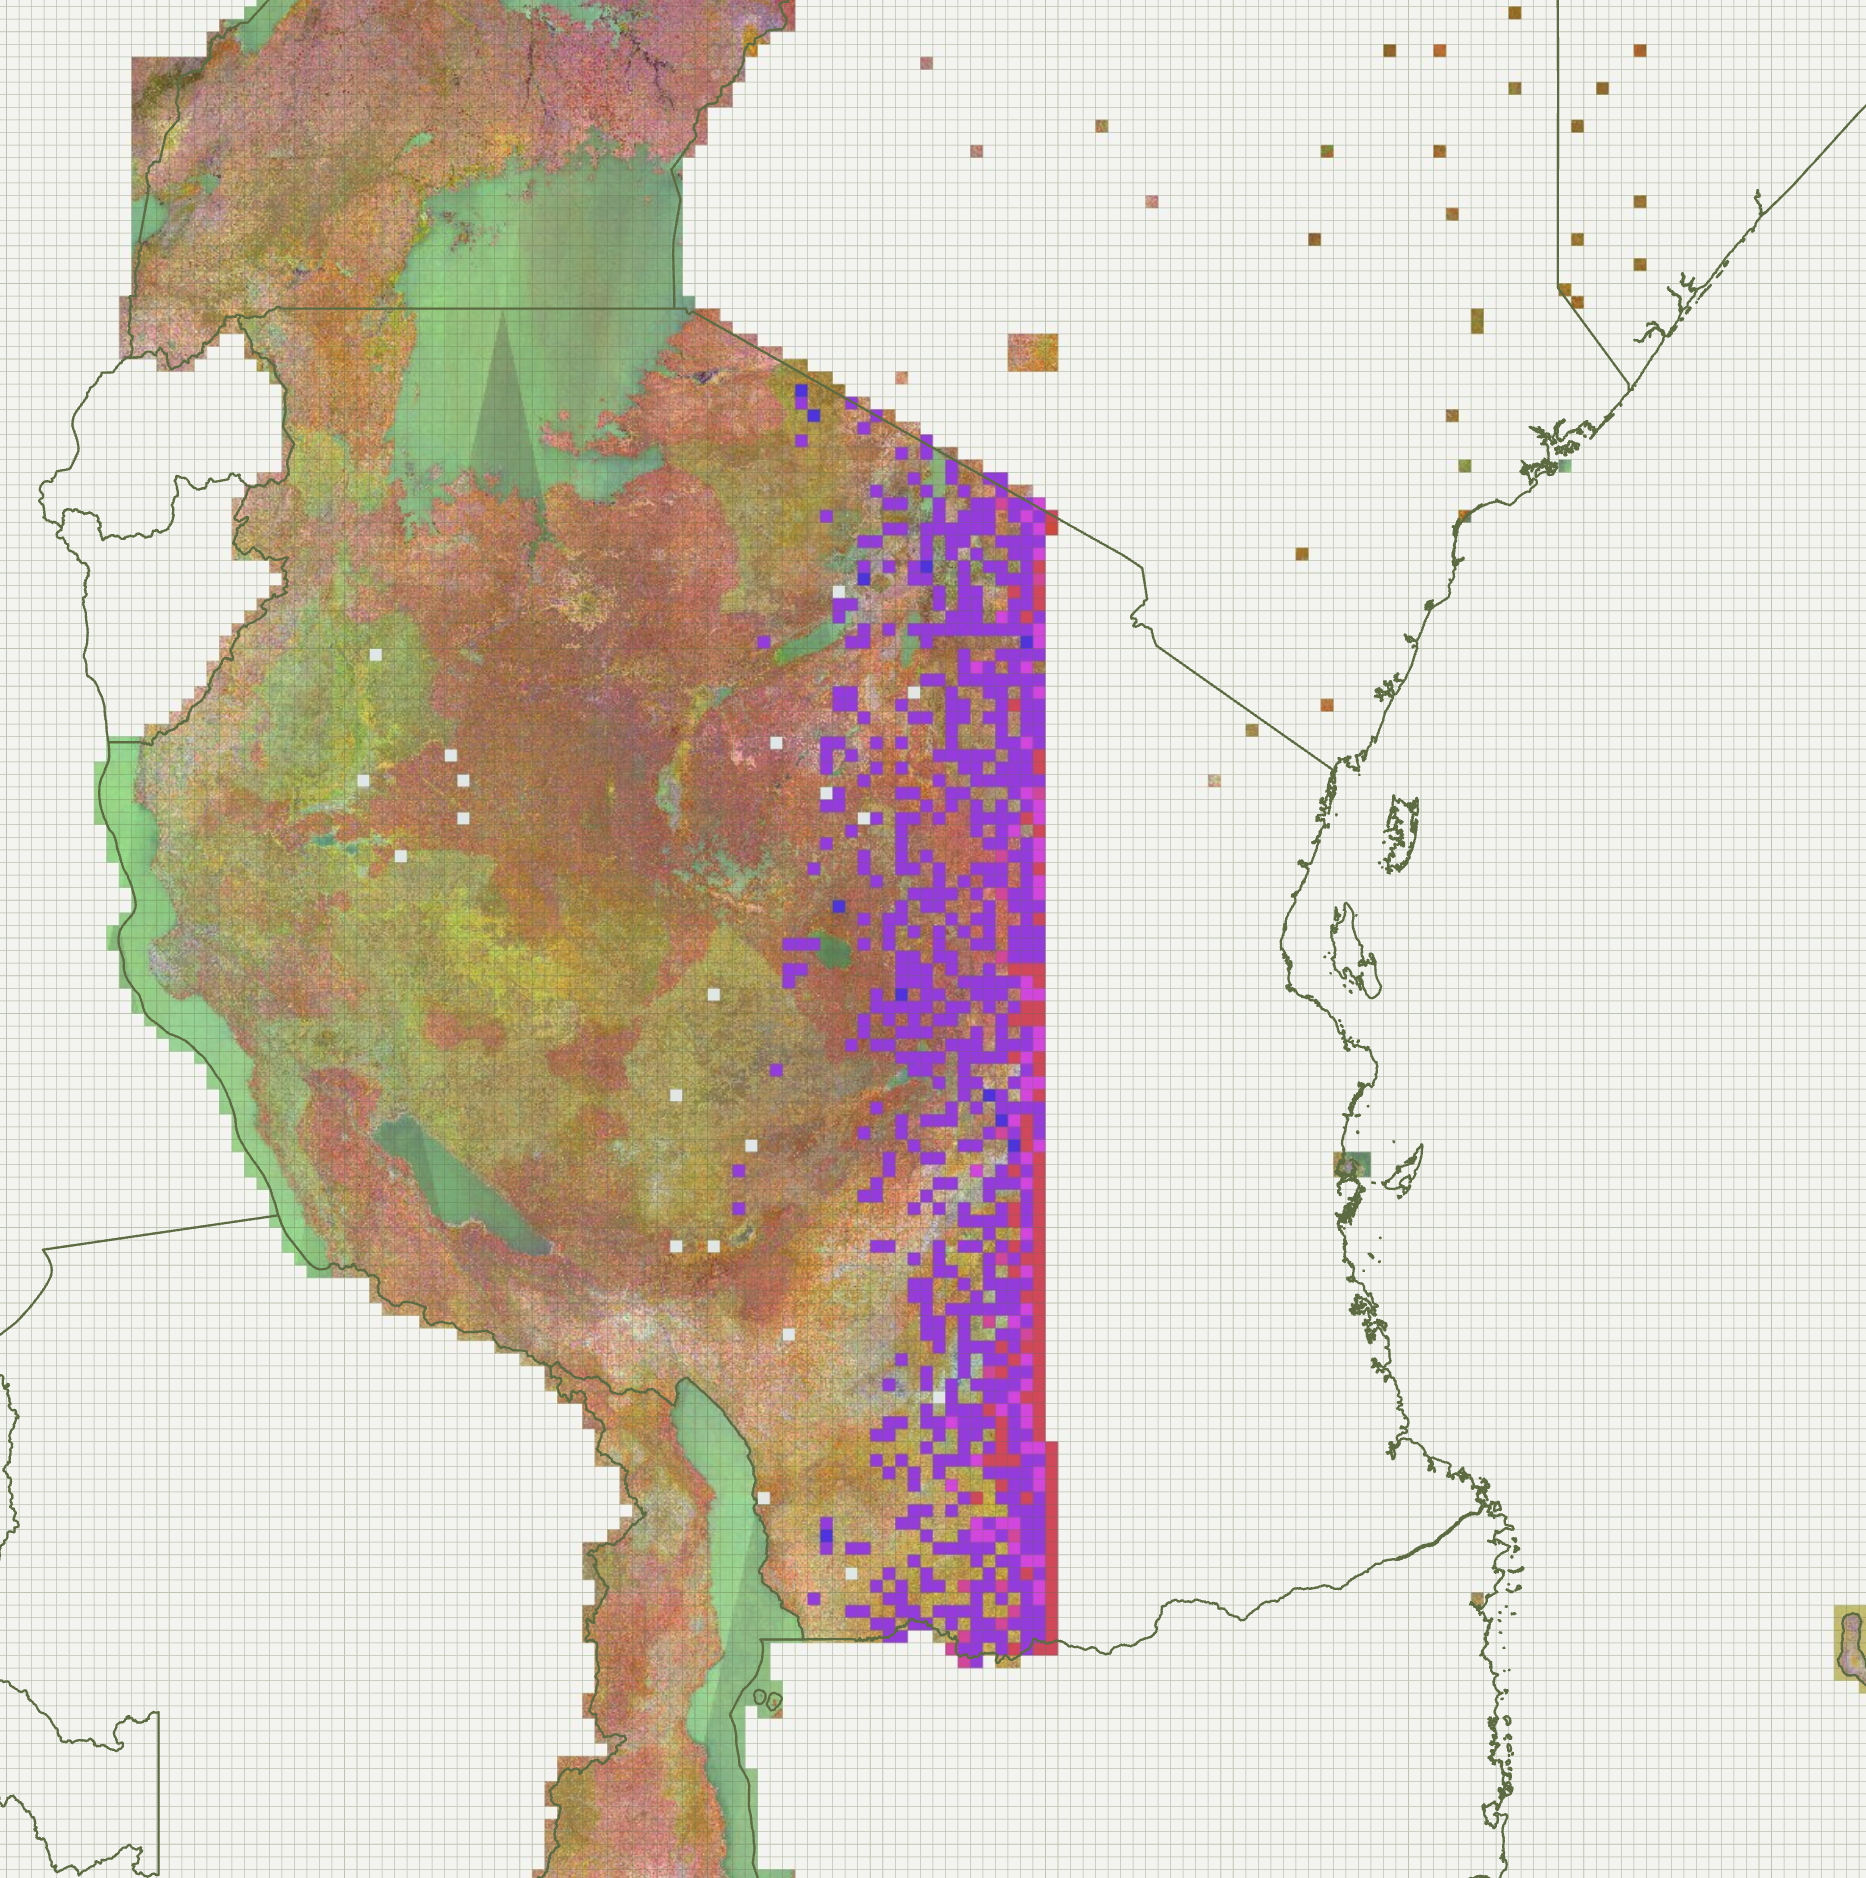
Third, this extension allowed me to add a POST /priority/<year>/<grid> with virtually no effort, providing a way to inject a specific cell at the front regardless of ROI. I exercised the POST /priority endpoint by submitting the whole of Tanzania, which enumerates to 7,992 tiles per year (see post graphic).
geotessera requests #
The public embedding-request registry grew from 43 to 48 features (~213K tiles), each verified to 100% coverage before closing: Saxony (#313, 300 tiles × 6 years for CAP crop-type classification), IIT Delhi (#314) and a Paraná experimental farm (#316). Geocledian’s request (#317) is a big one consisting of 21,220 tiles across ten sub-Saharan countries to compare against Google’s AlphaEarth. About 18% (Togo, Benin, Uganda, Côte d’Ivoire) was already done from earlier runs.
Source Cooperative: concurrency not bandwidth #
The Source Cooperative upload is now an unattended background job rather than the manual grind it was last week, thanks to two changes.
The first was throughput. With about 137 GiB uploaded, the rate was stuck under 50 MiB/s, roughly 40 times slower than the ~2.1 GiB/s okavango had briefly managed to the same endpoint. nload showed the network mostly idle, so it wasn’t bandwidth-bound. source.coop (now) routes writes through a Cloudflare Worker, which adds round-trip latency to every request, and aws s3 sync’s default of 10 concurrent requests couldn’t keep enough in flight to fill the pipe. Raising s3.max_concurrent_requests to 64 took it to about 3 Gbit/s and 128 to nearer 5, but I deliberately settled at 64. I’d rather leave some bandwidth on the table rather than saturate the link to JANET.
The second was the manual browser step. Last week’s source-coop login --duration 12h worked, but it opened a browser every 12 hours, which isn’t good for an unattended sync. Using Playwright, on a cron job, it authenticates and refreshes the 12-hour credentials. These are picked up via a credential_process in .aws/config, which allows them to be refreshed mid-run. I have the work split, so only a seriously locked-down machine has the actual credentials.
[profile source-coop-upload]
credential_process = /home/mte24/sc-creds-read.sh
Ceph #
The Scaleway RGW cluster’s buckets.data PG split from 266 to 512 PGs, which I’d feared would never finish, reached the home straight this week. Finally, all 512 PGs have been created. Recovery is running at ~200 MiB/s, with the Tessera v1.1 data being written at ~100 MiB/s continuously.
The cluster has mclock high_client_ops profile deliberately protecting write rate, but with 60 OSDs there is spare bandwidth for the recovery to continue at the same time. Pushing the recovery rate too high caused a host to be marked down due to the high latency of the spinning disks, causing the machine to miss some heartbeats. This unscheduled test of the fault tolerance showed that even with one host down, everything continued as normal. For the record, the scheme I settled on is EC 10+2: 83% storage efficiency, striped across 12 of 15 hosts, tolerant of two host failures.
The 32-bit compiler held green #
Not much to report here, which is the point. My OCaml compiler fork’s nightly “Rebase and Test Backends” job passed every single day this week, Sunday to Sunday, across all four revived 32-bit backends (PPC32, PPC64BE, i386 and 32-bit ARM). That confirms last week’s 32-bit ARM Iatomic_fetch_add fix adding the tiny C runtime helper that dodges the ldrex/strex register-pressure problem by lowering to a C call in selection.ml is durable across unattended rebases onto a moving upstream.