Fast Tessera inference that brings one Xeon node level with a GPU; reverse dependencies in day10; Windows, macOS and FreeBSD worker updates and a new ad hoc pipeline engine.
Tessera inference on Endeavour #
Intel gave us time on Endeavour to see whether AMX can compete with a GPU for Tessera inference. Last week, I was pleased with 56 tiles per hour per node against around 150 for one MI355X, but Sadiq said it should be better.
Building uxlfoundation/oneDNN and running benchdnn directly against the model’s actual shapes showed torch was passing weights in plain ba layout rather than the AMX-blocked BA16a32b2a, costing 1.7 to 1.8 times per call. The GEMMs were running at the PyTorch ceiling, where the real ceiling is about 203 TF rather than 121. This showed that, while I had calculated the best-case as roughly 97 tiles per hour, it is actually around 160.
From there, it was a sequence of measured steps on the 6980P node:
| step | tiles/h |
|---|---|
| eager PyTorch autocast | 56.2 |
| native bf16 | 60.3 |
| oneDNN-prepacked weights, fused ReLU and add | 81.9 |
| heap-only malloc | 96.6 |
| C++ thread-per-block library | 122.3 |
| per-chip S2 block size | 128.3 |
standalone tessera_encode, no Python |
136.5 |
I had originally ruled out the C++ rewrite, but I wanted the absolute control that this would give. I wanted to control the block size to ensure that, at each stage, the full width of the AMX unit was used, while also keeping the working set small enough to fit in one core’s cache rather than running each layer across all pixels. This yielded a 41% improvement.
The standalone encoder is a 190 KB binary plus oneDNN library and the weights. It produces byte-identical output to the Python path, and 93.3% of its int8 values exactly match the published beta1 tiles with a cosine of 0.99997.
Then we need to race the CPUs at Endeavour. One process on every physical core, for the same Manchester tile:
| machine | cores | matrix unit | tile |
|---|---|---|---|
| Xeon 6980P | 256 | AMX | 32.2 s |
| Xeon 6972P DDR | 192 | AMX | 34.0 s |
| Xeon 6966P-C | 192 | AMX | 35.0 s |
| Xeon 6787P | 172 | AMX | 46.6 s |
| Xeon 8592+ | 128 | AMX | 50.2 s |
| NVIDIA A30 | 60.1 s | ||
| Xeon 6745P | 64 | AMX | 60.9 s |
| 2 × AMD EPYC 9965 | 384 | AVX-512 bf16 | 66.9 s |
| Xeon 8480+ | 112 | AMX | 81.0 s |
| NVIDIA L4 | 118.5 s |
The EPYC line is a useful control. It has 1.5 times as many cores as the 6980P and takes twice as long, which puts AMX at about 3 times AVX-512 bf16 per core on this model. One AVX-512 bf16 instruction does 32 multiply-adds; one AMX instruction does 8,192.
It was interesting to see the higher-density chips throttle once every AMX unit is busy. On the 6980P a single 16-thread process runs at 3.39 GHz and the full node at 2.47 GHz, a 27% drop, which on its own accounts for most of the per-process slowdown. It is a per-socket effect: the floor is reached as soon as one socket is full and does not drop further when the second fills. It also tracks density. The 2 x 32-core 6745P loses 6%, the 2 x 96-core parts about 20%, and the 2 x 64-core 6767P does not throttle at all, sitting at a fixed 2.91 GHz whether one process is running or sixteen. The older Emerald Rapids and Sapphire Rapids parts are the worst at 33% and 30%, and they are also the two whose power counters are clean enough to show why: both are at the package power limit under load.
The upshot is that the 6980P’s lead is much smaller than its core count suggests. The 2 x 96-core 6972P comes within 6% of it per node, and per core it is ahead.
On the GPU side, I wrote a CUDA forward pass with the same C API, so the same encoder binary links against either. That was not strictly necessary, but spending a day optimising the CPU and then comparing it against an unoptimised GPU would not have been a fair test. On the L4: eager PyTorch 227 s, torch.compile 170 s, TensorRT 166 s, hand-written CUDA 118.5 s, against a cuBLASLt best case estimate of 83 s. So TensorRT buys almost nothing over torch.compile, and costs accuracy, and the hand-written version roughly doubles the best PyTorch route.
A surprising result was that the chunk size needs to be completely different per device. The A30 is best at 1024 pixels and the L4 at 64, a 16-fold difference, and the A30’s sweep spans 1.76 difference depending upon the chunk size. The A30 has 24 MB of L2 but about 933 GB/s of HBM2, so DRAM round trips are cheap and bigger GEMMs win; the L4 has 50 MB of L2 and 300 GB/s of GDDR6, so cache-sized chunks win. The same effect shows up in the bare cuBLASLt benchmark, where L2-sized chunks run about 40% faster than full batches.
Tessera one pixel fixed is merged #
Kristian Bodolai reported nodata seams in the Cambridge Zarr variants over Ecuador a couple of weeks ago. It is the one pixel offset from week 38, wearing a different hat: _tile_pixel_offset rounds where the producer floors, so a tile whose fractional offset from the zone origin reaches one half lands a pixel out. The fix is round to math.floor on two lines.
What is new is the second symptom. The displacement is invisible when you look at a single tile, because everything in it moves together. A seam appears only where a shifted tile abuts an unshifted one, which is why he saw it on some boundaries and not others. His example is two adjacent tiles with fractional offsets of 0.354 and 0.508, and the second is barely over the line:
grid_-79.35_-0.55  frac 0.354  round=50838  floor=50838  width 1113
grid_-79.25_-0.55  frac 0.508  round=51952  floor=51951  width 1114
The west tile starts at column 50838 and is 1113 wide, so it ends at 51951. Under floor, the east tile starts at 51951, and they abut exactly; under round, it starts at 51952, and there is a one-pixel gap.
I reproduced it from the tile geometry rather than from the data, added a regression test and checked that it fails on unmodified code before fixing anything, then ran a real conversion on Fargate against a scratch store and re-ran his own script:
SEAMCHECK utm17 lon -79.2999134 crs EPSG:32617 year 2024 shape (30, 30)
nodata_posinf 0
VERDICT: PASS_NO_SEAM
The old code gave 30: a full +inf column.
The seams are the small part. This affects the published v1.0, v1.1 and v2 Zarr stores where the .npy tiles themselves are correct. v1.1-dclimate is clean, because it came through the icechunk transcoder, which never calls this function at all, and where that path does use round it checks first and raises if the value is not already an integer.
ucam-eo/geotessera#433 is merged.
The Zarr stores will now be regenerated.
Tessera inference of Henan, Anhui and Jiangsu #
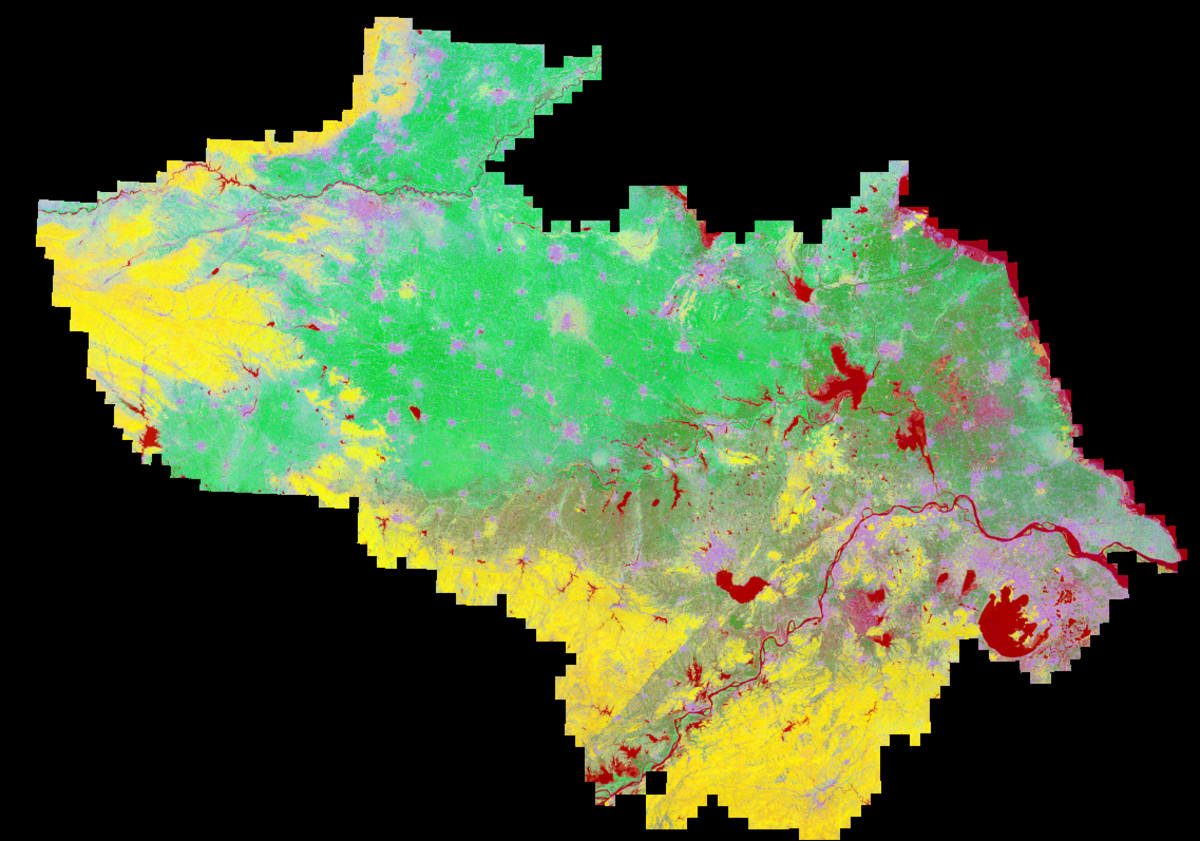
Cissy asked for three provinces in China: Henan, Anhui and Jiangsu, which is 4,204 tiles. Coverage for 2019 showed only 2,901 missing, so I thought that this was sufficiently small that I could run it on a single GPU with the new oneDNN binary. See later for how this was orchestrated. With this ROI processed, I am now working on Pedro’s weather stations ROI, which has around 10 times as many tiles.
day10 and reverse dependencies #
After last week’s flurry of issues to achieve parity with obuilder, this week was quiet, with only two actual issues being found. This gave some breathing room to extend mtelvers/day10 to the reverse dependency section of ocurrent/opam-repo-ci. The reverse dependencies are calculated via an ocurrent/obuilder job which runs three opam list commands and scrapes the output back out between markers.
I considered the same approach in day10, I could submit a day10 exec job to run any opam command, but this means that I would need to materialise the entirety of opam-repository to disk to pass to the container. day10 solves against the git database rather than materialising the files and only writes the files to disk for the exact solution it is going to build.
However, opam has a dedicated solver for reverse dependency lookup, whereas day10 was only using 0install-solver. Before writing anything, I measured the current performance:
| query | time |
|---|---|
| baseline repository load, no query | 0.89 s |
--depends-on only |
0.96 s |
--coinstallable-with only |
264 s |
| both together, as actually used | 8.0 s |
--coinstallable-with on its own keeps 16,955 of 19,143 packages, which is to say almost everything, and takes four minutes to say it. All of its value is in composition with the other flag.
Next, I needed a test harness to compare a yet-to-be-written day10 version with the results produced by opam. It runs the three opam list commands as the reference and day10 revdeps as the candidate, on two compilers, and diffs them. My test packages were coq and dune as the deliberate worst case, with 14,049 dependents, 73% of the available packages.
The day10 version runs in two phases, and only the second one solves.
The first phase is a single pass over the repository, building the candidate set from metadata alone. For each package it resolves depends and depopts against the variant, and a package is a direct dependent if either formula is satisfied by the target. At the same time it records, for every name a package depends on, the formula it depends on it by, which gives a reverse-dependency table. A closure over that table starting from the target then picks up everything that reaches it indirectly, which is the recursive query. Crucially the closure follows hard dependency edges only: running --recursive together with --depopts and --with-test, as a single combined query would, walks the closure through optional and test edges as well and answers a wider question, which is what turns coq’s 11 dependents into 20.
Matching is by version throughout, not by name. A package wanting dune < 3.0 is not a reverse dependency of dune.3.20.2, and on a target that most of the repository mentions, those are most of what a name-only match sweeps in: ignoring the constraints added 1,306 packages that opam excludes.
So no solving at all so far, just a fold and a graph walk. The second phase is the brute force: for each candidate, solve for the target and that candidate together at their exact versions, and keep the candidate if the solve succeeds. That is what --coinstallable-with asks, and asking it any cheaper way does not work. Solving for the candidate on its own does not ask it, because a package that depends on the target only through depopts solves perfectly well without the target present, and so passes for the wrong reason. zenon.0.8.5 is the example: it has coq in depopts and coq-core in conflicts, so a solution that omits coq never meets the conflict. Restricting the repository to a single version of the target has the same hole, since nothing then compels the target to be installed either.
That is one solve per candidate, so thousands of them on a target like dune, which is why the verb takes --fork.
Final agreement:
| target | opam | day10 | diff |
|---|---|---|---|
| coq.9.2.0 / 5.5 | 2 | 2 | -0 / +0 |
| coq.9.2.0 / 4.14 | 10 | 11 | -0 / +1 |
| dune.3.20.2 / 4.14 | 13,302 | 13,378 | -11 / +87 |
| dune.3.20.2 / 5.5 | 9,664 | 9,696 | -6 / +38 |
Wall clock, against the three opam list commands it replaces:
| target | opam | day10 |
|---|---|---|
| coq.9.2.0 | 17.7 s | 4.0 s |
| dune.3.20.2 / 4.14 | 112.0 s | 265.1 s |
| dune.3.20.2 / 5.5 | 92.0 s | 294.6 s |
So day10 is about four times faster on the ordinary case and two to three times slower on the worst one. That is the shape you would expect from the two designs: opam pays a fixed cost to load and index the repository and then answers cheaply, while day10 pays per candidate. For coq, with ten dependents, the fixed cost dominates and day10 wins. For dune, with 14,049, it does not. Nine minutes to decide what to build is noise against a work list of 13,000 builds, so this is not worth optimising yet.
That is 99.4% and 99.7% on dune across 16,664 candidates, and every remaining difference is understood. The eleven that day10 omits are all cases where it is right: opam includes the target in its own reverse dependencies, and day10 removes it; seven packages are macOS-only; and three are capped to an opam version the harness happens to be running. The 87 extras are depexts. opam consults the scheduler’s own apt and discovers that conf-gtksourceview needs a system package that is not available; day10 solves the opam universe and leaves depexts to the container.
The two other day10 fixes came out of real job logs. A layer was being renamed into place before its layer.json was written, and the “is this layer finished” check tested for the directory outside the lock, so a job arriving in that window found a directory with no manifest and crashed on utimes. Writing the JSON to the temp directory before the rename was the easy fix. And OBuilder sets CI=true where day10 did not, which matters for test frameworks that behave differently under CI. It went into day10 rather than opam-repo-ci because it is constant for every day10 container, and the layer hash deliberately does not include the ambient environment, so anything that varies between invocations sharing a cache would produce colliding hashes.
I’ll complete the opam-repo-ci side this week.
ocaml.org outage #
ocaml.org runs two instances as Docker containers behind a Varnish cache. The container logs were showing:
03.10.26 00:14:32.046 dream.logger ERROR Async exception: Unix.Unix_error(Unix.EMFILE, "accept", "")
Each server process held 65,490 open socket file descriptors against a limit of 65,536, with about 131,000 TCP allocations in a closed state against 113 live ones. Leaked, not busy.
The first explanation was DNS, and it was well evidenced. Docker’s embedded resolver was timing out against Scaleway’s upstream servers, about 38,100 errors in the 23:00 hour alone, and every documentation page fetch resolves through a blocking getaddrinfo in Lwt’s thread pool, so the 1,000-thread pool saturated as requests ran for hundreds of seconds.
I remembered seeing a similar issue on ocurrent/ocaml-ci when it was being scraped by bots. At the time, the upstream logs fetch was slow due to a SQL key issue resulting in abandoned connections. The solution at the time was two commits: the first caught the write loop never resolving its exit promise on an exception, and then production strace showed the read path was the dominant leak, so the second made Io.close shut down best-effort and always close. That pin has been running ocaml-ci, which is why the shape of this one was familiar.
The defect is in anmonteiro/gluten, and it is the same two bugs: Io.close calls shutdown and then close inside a single exception handler; on a socket the peer has already reset, shutdown raises ENOTCONN, the handler swallows it, and close is never reached. And the IO loop only closes its socket once both the read and write loops have resolved their exit promises, which only happens on the clean path, so a loop that terminates by raising leaves the join waiting forever. strace shows it exactly:
read(6, "", 4096)       = 0
shutdown(6, SHUT_RDWR)  = -1 ENOTCONN (Transport endpoint is not connected)
and no close(6).
Every request in which the client leaves before the response is fully written leaks one descriptor. Normally, completed requests do not, which is why the site runs for days until something slows responses enough that clients give up on it. A harness of twenty clients that disconnect after 50 ms:
| baseline | 20 FIN | 20 RST | 20 normal | |
|---|---|---|---|---|
| as shipped | 6 | 26 | 46 | 46 |
| with the fix | 6 | 6 | 6 | 6 |
and in Docker, 100 reset connections against a documentation page take the old image from 7 descriptors to 94 and the new one from 7 to 6.
Currently, the site is being built from a patched branch on mtelvers/gluten, pinned into ocaml/ocaml.org through pin-depends so that CI and the devcontainer get it too. I have also sent the fix upstream as anmonteiro/gluten#90, where it joins #88 fixing the same two-part bug in the Async backend.
A Windows worker that can use its whole disk #
ltsc2025-3 is the last Windows worker without a separate Docker volume, which makes it the last one that can still hit the shared-volume prune livelock. The others were straightforward to split, because they have sub-2TB SSDs where MBR reaches the whole disk. This one has an 8TB spinning disk, and MBR can’t reach beyond 2 TiB, so the remaining 5.3 TB is not space I could claim: it is unaddressable. Splitting it means UEFI and GPT, and I had been putting that off, as QEMU with UEFI and GPT typically takes a good number of iterations before it’s working as I want. In practice, my reservation was misplaced: ovmf was already installed, the change is a q35 machine type, a pflash drive and a per-VM copy of the variables file, and an answer file with EFI and MSR partitions and InstallTo pointing at partition 3 instead of 2. The result is C: at 5,120 GiB for obuilder/hcs and D: at 2,332 GiB for Docker, using the whole 7.3 TB. It is built alongside the old machine rather than over it, and now that it is taking jobs, ltsc2025-3 can be retired.
macOS workers #
Three arm64 machines were in a launchd crash loop because the OpenZFS kext was not loaded, which was in turn because ZFS spacemap corruption was panicking the kext on auto-import at boot, and macOS had then evicted ZFS from the auxiliary kernel collection. The error message is actively misleading: it says the extension is not approved even though it is. What was missing was the kext in the booted collection, and a reboot did not restore it. I’ve seen this before, and the fix is to wipe the ZFS partition with zeros so ZFS doesn’t try to read the corrupt data. Once done, the kext can be loaded again, and the Ansible playbooks can be used to rebuild the machines. I also took the opportunity to update to the latest openZFS driver.
/maps moves to CephFS #
/maps is the shared research filesystem consisting of about 120 TB on an NFS server congo with all users squashed to uid:gid 400:400. It had reached 100% with 17 GB free. Users deleting files freed nothing because the ZFS snapshots hold it.
I had taken a CephFS mirror using rsync back in April. I ran incremental updates but since writes were blocked only the first one actually did anything. The cutover to CephFS took seconds across all three client machines, using a lazy unmount. This allows running jobs to keep working against the detached mount for days afterwards. 120T at 100% became 402T at 82%.
Every file on /maps is owned by uid 400, because congo’s NFS export all-squashes, and kernel CephFS does not remap. A straight switchover would have locked everyone out of their own data. That was handled with a maps group at gid 400 on all three machines, which in turn required an audit that found 63 colliding uids, which in turn became a renumbering of 74 accounts into a 30000 block across three machines. Everyone rather than just the clashes, because then nobody feels singled out.
The only real user-visible breakage was permissions rather than downtime, and only for people whose login predated the group change, since process group lists are fixed at login.
occ reaches parity on RISC-V #
Last week, I left off with mtelvers/occ having just lazy3.ml failing, as it was too slow on the bytecode interpreter. The diagnosis was that caml_bytecode_interpreter is one enormous function whose dominant loop spans the whole body, so every variable looks live everywhere, and with far more of them than there are registers, so key values get reloaded from the frame on every opcode.
The register allocator was approximating live ranges by extending them over whole loops. That rule is ruinous for a function which is one loop with a hundred arms. Taking live intervals off the flow graph from proper live-variable analysis instead:
| original | threaded only | with live intervals | gcc -O2 | |
|---|---|---|---|---|
| wall clock | 59.4 s | 63.4 s | 15.0 s | 9.5 s |
| instructions | 10,490 | 6,950 | 3,118 | |
| frame accesses | 5,139 | 681 | 335 |
Four times faster, and from 6.2 times slower than gcc to 1.57. Both changes were needed; neither does much alone. lazy3.ml, which had been timing out at about 630 seconds against a 600 second limit, now passes.
That leaves RISC-V at 1,618 passed, 60 skipped, 1 failed, against a gcc-built tree on the same board on the same day at 1,621, 57 and 1. Both fail the same test, and for an upstream reason: OCaml ships a reference file under one name, and ocamltest looks for another. The three tests have a gap: two require a C++ compiler, which is out of scope by design, and one requires -ffunction-sections, which occ does not emit.
ferry #
My ad hoc Tessera pipeline was four terminal windows: xargs running GPU inference, another downloading tiles, another uploading to S3, another pulling them down on a second machine, with manual restarts between batches and dispersed over several machines. As an ocurrent/ocurrent maintainer, it is clearly the best pipeline tool available, but it’s not the thing I reach for when the work is ad hoc.
So mtelvers/ferry: stages that each run a shell command on a named host over ssh with their own concurrency limit, where an item moves on as soon as its job exits. It has a notty TUI, runs jobs in their own process group with remote work under ssh -tt, so killing ferry kills the remote side too, and journals finished stages so that a restart resumes correctly.
Here’s what a pipeline might look like. Say you have a pile of scanned PDFs on the NAS and want them searchable. Splitting a PDF into page images is quick; running OCR over those pages is not, and it wants the fast machine.
open Ferry

let nas  = host "nas.local"     (* where the scans live *)
let fast = host "fast.local"    (* has the fast CPU *)

let () =
  items nas "ls ~/scans | sed 's/[.]pdf$//'"
  |> stage "split" nas ~jobs:4 ~out:"~/pages/{id}/"
       "pdftoppm -r 300 -png ~/scans/{id}.pdf {out}/page"
  |> limit 8
       (move "fetch" (at fast "/scratch/{id}/")
        >>> stage "ocr" fast ~jobs:2 ~consume:true ~out:"~/text/{id}/"
              "tesseract /scratch/{id}/page-1.png {out}/text"
        >>> move "file" (at nas "~/searchable/{id}/"))
  |> run
Four jobs concurrently run the splitting, with two doing OCR, and limit 8 keeps at most eight documents on fast.local ready for processing, so the splitter cannot run a thousand PDFs ahead of the OCR and fill the scratch disk. That gate is the thing that the four terminal windows could not give me. My download ran unchecked and much faster than my GPU could run the inference.
Everything else follows from ~out. Because each stage says what it produces, move needs only a destination and finds its source wherever the previous stage left it; a restart lists the outputs once and starts each document after the furthest stage that already has one, so work done before a crash is never repeated; a command that mentions {out} writes into a temporary directory and is renamed into place only on success, so a half-made result cannot look finished; and ~consume:true deletes the staged pages once the OCR has succeeded. None of that is written in the script.
The script is OCaml, and it is not compiled by anything you have to install. ferry links compiler-libs.toplevel and is built (modes byte_complete) with -linkall, so the bytecode runtime is inside the executable. The only other thing a toplevel needs to typecheck a script is the compiled interfaces to typecheck it against, so a dune rule globs the 69 .cmi files of the stdlib together with Ferry’s own and runs them through a twelve-line generator that emits
let files = [
  ("camlinternalFormat.cmi", "\132\149\166\190...");
  ...
]
This is then just another module in the link. The result is a single self-contained 6.6 MB binary with the OCaml compiler inside it. There is nothing to install on the machine you run it from, and nothing to build before a pipeline runs, and a type error arrives before any host is contacted.
The interface has changed with each new commit: it started as a line-based spec file, and became OCaml scripts within the hour. Then commands became functions of the item, and host settings became typed records rather than string variables. Declared outputs came last, and removed the skip checks, the done-lists, the environment exports and the line format in one go.
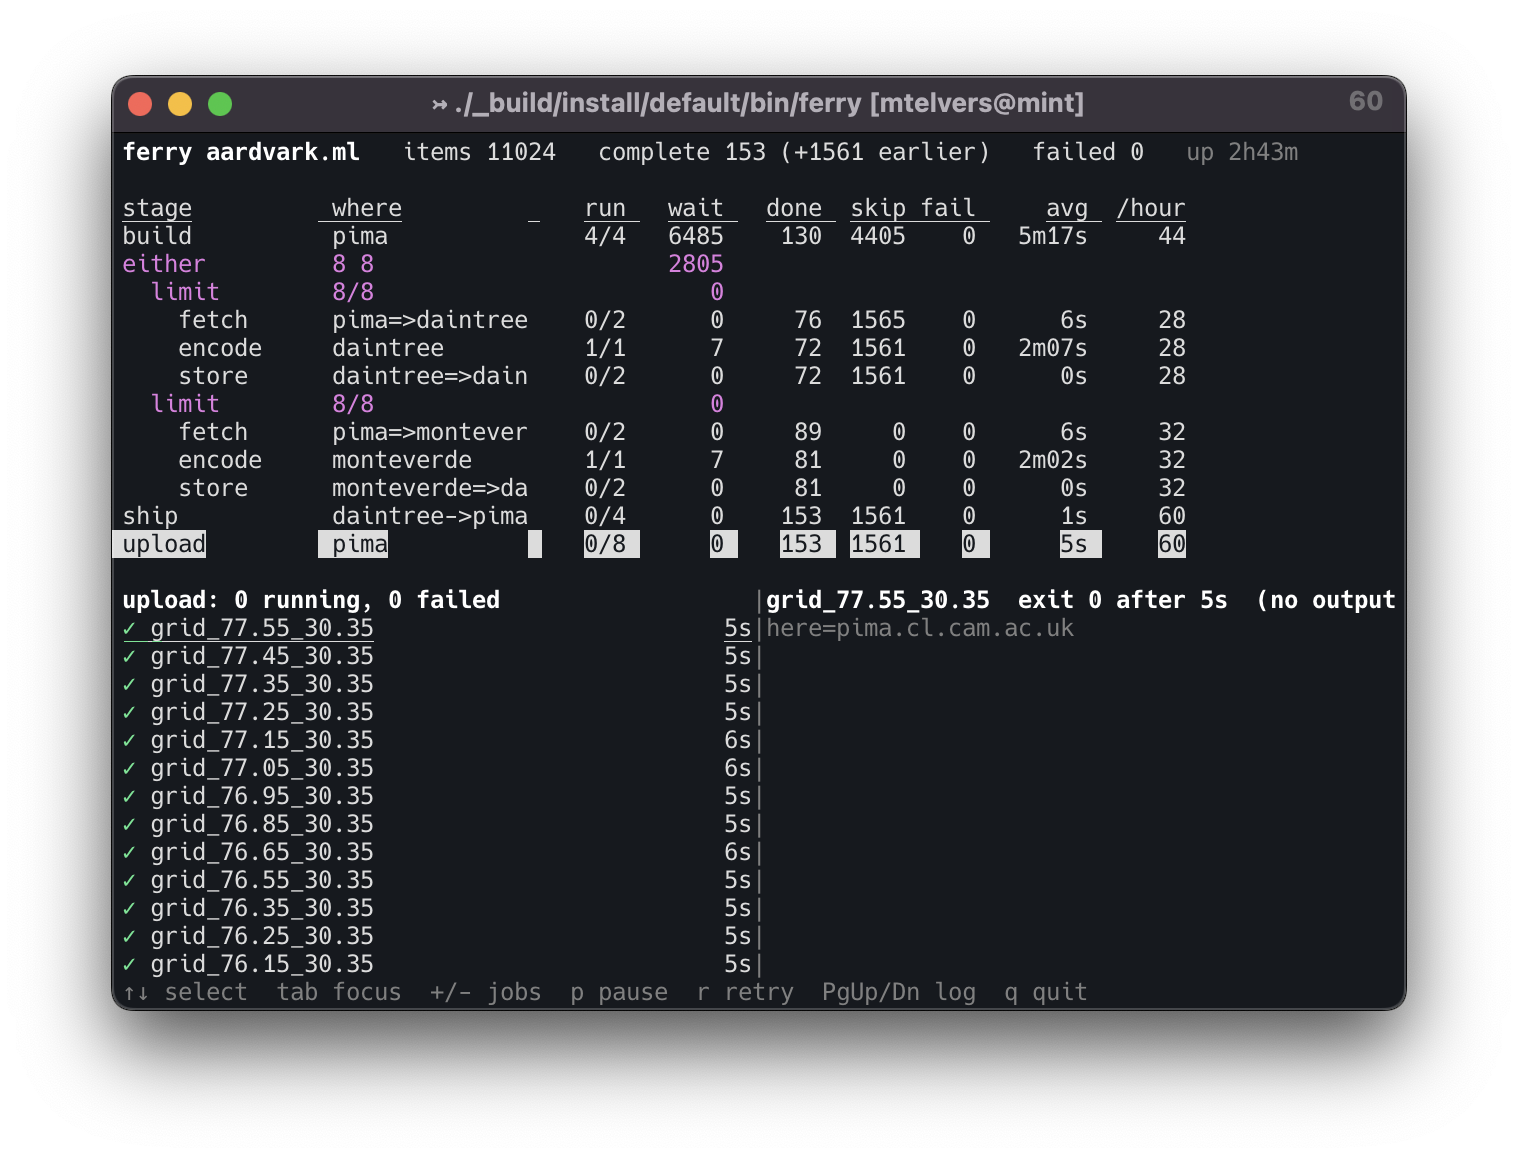
The real thing: 11,024 tiles, built on pima and encoded on two GPUs. The either gate sends each tile to whichever branch has room, so daintree and monteverde pull 28 and 32 tiles an hour without being told how to share the work.
ocurrent 0.8.0 #
The Prometheus 2 work from the last two weeks is finished and released: ocurrent/ocurrent#479 for the synchronous collector and #477 for the git argument handling. 0.8.0 rather than 0.7.6 because requiring Prometheus 2.0 raises the minimum for everyone downstream.
The order then matters, because nothing downstream can pin a repository sha containing 0.8.0 until it is actually there. So: the release into opam-repository as ocaml/opam-repository#30827, then the Dockerfile sha in ocurrent/solver-service#84, then ocurrent/ocaml-ci#1075 and ocurrent/opam-repo-ci#488 picking up the new bound. All merged.
32-bit OCaml #
The 32-bit compiler fork needed a real fix rather than just a rebase. Upstream now converts between floats and boxed integers without calling into C, but the direct path uses native-word integers, so on a 32-bit target Int64 boxing leaves the upper half undefined and Int64.of_float 0. returns 8796093022208. Int32 and Nativeint are word-sized there and keep the fast path. That fix then broke three nightly builds in a row, because I had declared the C calls alloc=false when both of them do allocate, which skips the wrapper that makes the OCaml stack walkable.
FreeBSD worker #
rosemary has now been healthy for ten days. On Friday, the no-solution job time roughly doubled, and resident vnodes increased from 140k to 825k. However, this didn’t appear significant as vmstat -z shows the vnode zone has never once failed to allocate in 2.5 billion requests. The machine had 162 open files and no jails, so the average time increase is probably just down to a busy machine for those few samples.