I frequently want a quick way to monitor things from the shell, be that watch -d df -h, or while true loop, or an awk script. The scripts become increasingly complex when you want to measure the difference between the current and previous value. The solution is mtelvers/terminal-plotter.
I set out to write this in Mosaic, but I ran into various bugs within the framework, so I abandoned it in place of the pqwy/notty and the histograms I created for ocluster-monitor.
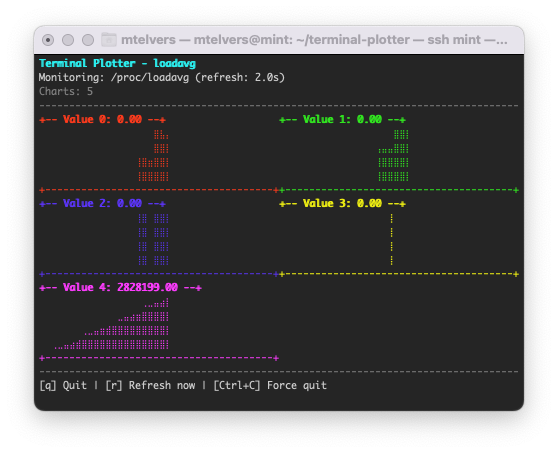
Consider /proc/loadavg: typical values are shown below, where the first 3 are the load averages over 1 minute, 5 minutes and 15 minutes, and there is 1 process running out of the 623 on the system, and the final value is the PID of the most recently created process.
0.04 0.02 0.00 1/623 2828549
A simple use case is to run terminal-plotter --file /proc/loadavg, which reads /proc/loadavg every 2 seconds and displays the values in 5 graphs. The entry 1/623 is automatically considered a fraction.
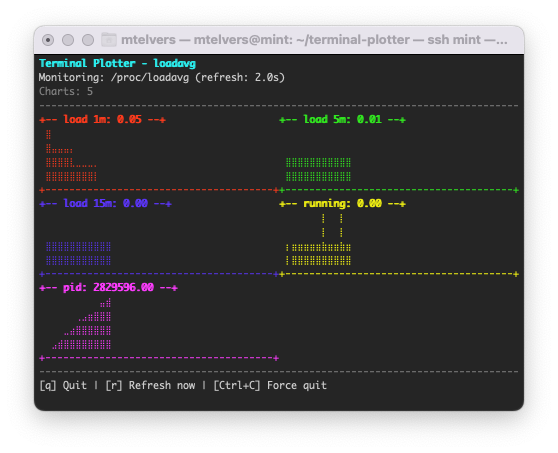
You can add labels to your charts. In the example below, c0 represents column 0, c1 column 1, etc.
terminal-plotter --file /proc/loadavg \
  --value "load 1m:c0" \
  --value "load 5m:c1" \
  --value "load 15m:c2" \
  --value "running:c3" \
  --value "pid:c4"
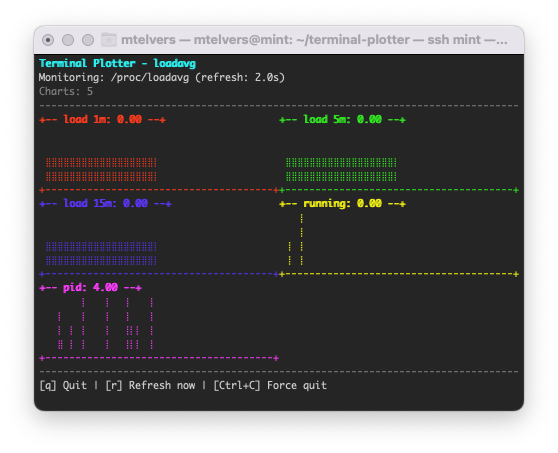
Since pid always increases, graphing it is a bit pointless. We’d rather see the difference between the current and previous values. We can use --counter to indicate that we want the delta rather than the absolute value.
terminal-plotter --file /proc/loadavg \
  --value "load 1m:c0" \
  --value "load 5m:c1" \
  --value "load 15m:c2" \
  --value "running:c3" \
  --counter "pid:c4"
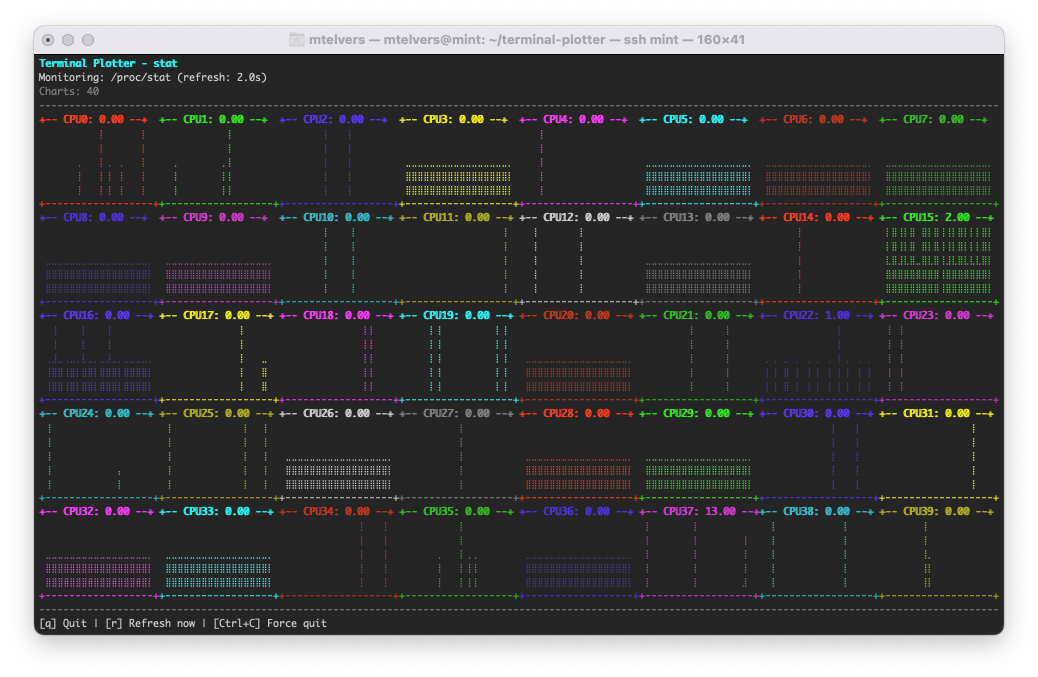
Imagine a more complex example of /proc/stat. Here we can see the CPU activity for each processor following the first line, which aggregates the values below.
$ cat /proc/stat
cpu  67153280 1763 14886491 1223984556 65971570 0 59050 0 0 0
cpu0 2029319 125 556429 29970217 1631023 0 1612 0 0 0
cpu1 2002631 152 467156 29813299 1980226 0 1344 0 0 0
cpu2 1918663 134 425357 29983099 1957736 0 1346 0 0 0
...
Here, we can use the r1c0 notation to indicate the number in row 1, column 0 (the first numeric value on the second row). The example sums the various jiffy counters and plots the difference between the current and previous value.
terminal-plotter --file /proc/stat \
  --counter CPU0:r1c0+r1c1+r1c2+r1c4+r1c5+r1c6 \
  --counter CPU1:r2c0+r2c1+r2c2+r2c4+r2c5+r2c6 \
... etc
After crafting a complex command line, you can save it to ~/.terminal-plotter with a unique key, then future invocations can load the settings from the file. e.g. terminal-plotter loadavg will load the profile loadavg from ~/.terminal-plotter containing:
loadavg --file /proc/loadavg --value "Load:c0" --value "load 5m:c1" --value "load 15m:c2" --value "running:c3" --counter "pid:c4"
You may recall my awk script for dmsetup, which I used to monitor dm-cache. This can be implemented as below.
terminal-plotter -i 15 --exec "sudo dmsetup status fast-sdd" --value c6 --value "Read Hits: (c7/(c7+c8))" --value "Write Hits: (c9/(c9+c10))" --value "Dirty:c13" --counter "Demotions:c11" --counter "Promotions:c12"
You can use standard arithmetic expressions using either rNcM or cM notation.