ocaml.org memory and CPU improvements; the first Tessera block processed straight into the Zarr store; a CephFS kernel bug that returned zeros for files that were fine; and day10 updates.
ocaml.org #
Same symptom, different cause #
On Sunday, ocaml.org was serving Backend fetch failed again. The file descriptor leak in gluten that caused the same error on 3 October was fixed and deployed, and it was verifiably not the problem, as the number of open file descriptors was less than 100.
However, the kernel OOM-killed the server three times, with memory usage ranging from 6.2 to 7.3 GB each time. Looking at it early on Monday showed the backends were at 3.5 to 3.8 GB with 290 MB free on a 15 GB host. Each OOM kill is a window during which Varnish returns a 503 until Docker brings the replica back.
top showed that the CPU for each backend process was locked at 100%.
74% of requests were for documentation pages, cache misses outnumbered hits four to one, and the top user agent, a single Chrome-on-macOS string, came from 3,874 distinct addresses, most likely a scraper farm, as we have seen before.
The logs showed that packages without docs created multiple upstream requests. A request for /p/<pkg>/latest/doc/ walked every version fetching status.json from docs-ci. One request for ocaml-system made 65 upstream fetches and took 516 seconds to produce a 404. And every doc page downloaded the package’s whole odoc search index to compute a cache-busting digest.
Profiling the production image #
I pulled the exact production image by digest and replayed 1,500 real documentation URLs from Varnish’s log at 32-way concurrency, with Accept-Encoding: gzip exactly as Varnish sends it. That reproduced the main thread at 100% and 2.5 second average latency.
Every documentation page renders the package’s entire module tree in its left-hand navigation, and on 41 sampled pages, that tree accounted for a median of 97% of the bytes. The median page is 492 KB uncompressed, p90 2.7 MB, p99 8.2 MB, and the largest 22 MB; core and frama-c pages are 6 to 8 MB of HTML wrapping about 35 KB of content. The navmap data was cached but re-rendered to HTML on every request.
Per 1,500 requests, the backend spent 82 CPU-seconds with gzip and 52 without gzip, so compressing those pages in pure OCaml on the single Lwt thread accounted for 37% of that time. Of the rest of the time: major GC 27%, memcpy and page faults 32%, a fresh TLS handshake per upstream fetch 8%.
The allocation side was worse: 338 pages in 20 seconds mapped 9.5 GB in large blocks and unmapped 9.5 GB, about 28 MB of allocation per 1.2 MB response, approximately a 23-times amplification of data served. The recursive template returns each level’s string into its parent, so the sidebar is copied once per nesting level, then through Buffer doubling, html_escape, the Dream body and gzip. The runtime image is Alpine, and musl’s malloc mmaps every block over about 128 KB and unmaps it on free, which is where the thousand mmap calls a second came from.
Gzip moved to Varnish #
To ease the load on the backend services, I moved the gzip to Varnish by configuring vcl_backend_fetch to drop Accept-Encoding: gzip and setting do_gzip on text responses in vcl_backend_response. Varnish compresses in its worker threads with zlib and stores the gzipped object. Measured locally against the production image that was about 40% off the backend’s CPU. Updating the production server resulted in a 20-30% reduction, indicating that the CPU thread was no longer at 100%.
The sidebar as a fragment #
Cuit opened #3854, memoising the rendered tree per package version. I built it locally and gathered performance metrics comparing it to the unpatched version: CPU per response 54 to 42 ms, a 22% saving, but the memory churn barely moved, dropping from 474 to 426 MB/s, and of course, RSS went up. Caching the tree removes the render but not the five copies of it, and the sidebar still accounted for 97% of every byte the GC had to sweep. I added my analysis on to the PR.
Then I tried another idea: #3858 replaces the tree with a small placeholder carrying the current page’s path and an htmx hx-trigger="load" that fetches the tree from /p/<name>/<version>/doc-sidebar, served with Cache-Control: public, max-age=600. The tree now uses the same HTML for every page of a specific package version, which will be cached by Varnish. The browser reads the current path and uses Alpine.js to expand the branch and mark the current module.
| before | after | |
|---|---|---|
| backend CPU per page | 54 ms | 16 ms |
| average page | 1,210 KB | 130 KB |
| large-block churn | 474 MB/s | 65 MB/s |
The fragment itself costs 26 ms and averages 948 KB, once per package version per ten minutes. Cuit offered to add the backend memo from #3854 on top, but measurements show little benefit at the cost of doubling the RSS.
A fetch cap that leaked a socket #
Cuit also wanted to merge #3767, his fix for #3765 which caps the upstream fetch to 50 MB and adds a HEAD request for the index’s ETag instead of downloading it to hash.
When reviewing it, I noticed that the “response too large” path returned without draining or closing the cohttp body, so every rejected fetch leaked a socket. To prove it leaked, I lowered the cap to 100 KB and requested a selection of pages: 44 rejections, file descriptors from 6 to 50, 44 upstream sockets still open five seconds later. Cuit pushed a fix with an explicit connection closed on every exit path. Running the same test again showed that the file descriptors held steady.
Grafana dashboard #
ocaml.org should report metrics to our Grafana dashboard, but the recent data was absent. This turned out to be an issue with the startup sequence. The node exporter on the host binds the Docker bridge gateway so the containerised front end can reach it. docker0 does not exist until Docker has started, and the systemd unit has no ordering on docker.service. At the last reboot, node exporter started before Docker and exited immediately. I have added the ordering dependence and a Restart= directive.
Memory that grew with every package version #
Both PRs went out with Cuit’s usual morning updates on the 21st. With Grafana now able to provide feedback on memory usage, it was clear that RSS was growing at about 80 MB per hour. The production instance had served 23,472 distinct package versions since the last restart, out of roughly 30,000 that exist. Replaying 3,000 doc URLs locally showed that RSS grew with each page fetched. However, replaying the same 3,000 did not cause a second increase.
The status cache in documentation.ml was a Name.Map of Version.Map holding the parsed status.json for every version ever requested, with a TTL on freshness but no eviction. Each record carried the package’s complete file list, which the code only searches for README, LICENSE and CHANGES. Looking at the worst case, awso lists 115,896 files needing 36 MB of heap.
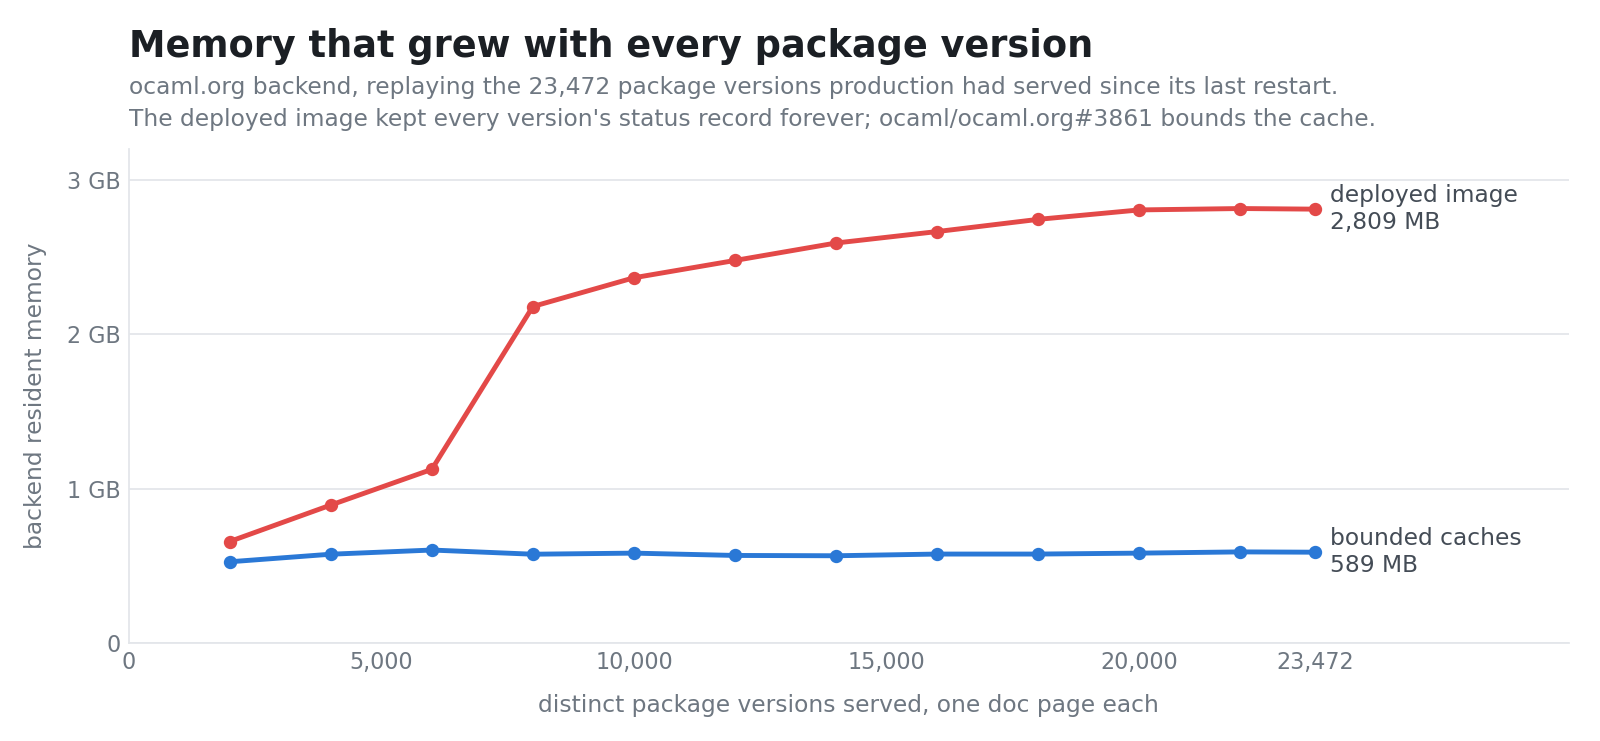
I replayed all 23,472 versions, one page each, sampling RSS every two thousand, and that is the header chart. The deployed image climbs to 2,809 MB, consistent with the 3.4 to 3.5 GB production reached on the same traffic.
#3861 keeps only the records which are needed and moves the status and search-index caches onto the same Bounded_cache the page and sidebar caches already use. With these changes, the memory usage is around 600 MB.
Cuit caught something I had missed: package.state is written with Marshal and includes these caches, and I had changed their layout without bumping Info.version, so an old state file would pass the version check and be reinterpreted.
Before and after #
Three hours after the final deployment compared with the previous days:
| before | after | |
|---|---|---|
| main thread busy | 55 to 104% | 10 to 11% |
| CPU per response | 65 to 95 ms | 11 ms |
| responses over 10 s, of the last 20,000 | thousands | 0 |
| RSS per backend | 3.5 to 3.8 GB, climbing | 1.8 to 2.1 GB |
| open file descriptors | hundreds | 13 |
| Lwt pool threads | 786 | 18 to 34 |
| OOM kills | 3 in two days | 0 |
Varnish was serving the sidebar fragment from cache about 85% of the time.
day10 #
Post dependencies, built #
Shon’s opam-repo-ci#489 from the day revdeps went live was the merlin test suite failing on day10 with Program ocaml-index not found in the tree or in PATH while passing on the main pipeline. The cause was day10 issue #7: the dependency tree used one name set for two purposes, which packages are in the build and which must be built first, and post names were removed from it so that a cycle through a post dependency (ocaml and ocaml-base-compiler name each other) could still be sorted. However, that also removed them from the build. A post dependency reached no other way was solved for and then absent from the switch.
8d1dadd added the package’s own post dependencies to its tree for tests. I measured the solution of every package in opam-repository on both compilers. No build graph changed and nothing moved between solvable and unsolvable. Every test graph that moved belonged to a package declaring a post dependency which is ten on 5.5.1 and eight on 4.14.2. merlin built ocaml-index as a layer beneath it and its tests passed.
1fbc0e5 extended the same treatment of post dependencies to plain builds, because issue #6 turned out to be the same bug. ocaml-option-llvm’s only dependency is ocaml-variants {post}; with that edge dropped, the tree was one node. day10 now solves for and builds ocaml-variants.5.5.1+options, which is what opam does under --update-invariant. 43 build graphs on 5.5.1 and 62 on 4.14.2 change, all for post-declaring packages; frama-c gains its conf-graphviz, and a package depending on frama-c does not. This is a deliberate divergence from OBuilder, which starts from a switch with a compiler already in it, cannot install the option there, and simply reports this as a skip.
A depopt that was not filtered #
Hugo opened day10#8 on Thursday morning, and diagnosed it in the report. On the js_of_ocaml 6.5.0~beta2 pull request, every wasm_of_ocaml-compiler,tests job died before building anything, with Assertion failed in topological_sort. These numbered about 44 jobs across the distributions. wasm_of_ocaml-compiler depends on out-channel-redirect {with-test}, and out-channel-redirect has a depopt on wasm_of_ocaml-compiler {with-test}. In opam, with-test is true only for the package under test, so for a mere dependency that depopt evaluates to nothing and there is no cycle. day10 reads depopts through OpamFormula.all_names, which ignores the filter.
I was surprised that this had not come up before, as depends had always been filtered through the package’s environment and depopts never had. Reviewing the 1,345 package versions that have depopts, 747 are filtered, and the fix changes none of them. The first package where this set of conditions occurred was the one added under the PR. This has been addressed in 7dd1238.
Whiteouts lost #
A job on doris building conf-libXft.1 on Arch died with
cp: cannot overwrite non-directory '.../lower/var/lib/pacman/local/pkgconf-3.0.7-1' with directory '.../fs/var/lib/pacman/local/pkgconf-3.0.7-1'
day10: internal error, uncaught exception: File "bin/linux.ml", line 238, characters 8-14: Assertion failed
A build’s layers are merged into a single lower directory by hardlinking them in turn. A layer is an overlayfs upper directory, and a path the build removed is recorded there as a 0:0 character device, a special whiteout marker, rather than being absent. The merge carried those markers across as they stood. The issue arises as cp will not copy a directory over a device node, so a layer that removed that name earlier failed at the assertion. When the copy order happened to put the directory first, the marker was silently dropped by cp. This caused pacman to report two versions of pkgconf in its database.
877f330 applies the layers in the order they were installed, base-most first, with each layer’s whiteouts removed from the merge before it is copied and the copied markers dropped again afterwards. I was concerned about a performance hit with this change, so I ran an analysis. Running both find and cp was marginally slower, but the majority of the cost was sudo. However, there was an easy optimisation: cp takes any number of sources and applies them left to right, so a run of clean layers can be done in a single sudo cp, and the markers are found by a single sudo find. Previously, a hundred-layer merge was a hundred sudo cp invocations taking around ten milliseconds each, whereas now it’s just two commands. This has better than halved the time taken for my test layer from 1.70 s to 0.61 s.
Dependents whose own solution holds the target #
David asked why the revdeps for ocaml_intrinsics_kernel.v0.17.3 were testing alt-ergo.2.5.1. Both day10 and OBuilder list it as a reverse dependency. This turned out to be a legitimate static dependency through base, ppxlib 0.25.1 and earlier, ppx_blob and alt-ergo-lib. It looks strange as ocaml_intrinsics_kernel.v0.17.3 does not appear in the final day10 solution as ppxlib.0.13.0 cannot install on 5.5, and the solver takes ppxlib.0.39.0, so the job’s actual solution contains neither base nor the package under test.
day10 runs the solve, so could drop these packages. However, after having written that, this changes the coinstallability part of the revdep test.
OBuilder’s revdep job pins the target and then installs the dependent, so it tests that the two can share a switch, including conflicts through shared dependencies. day10’s dispatch installs the dependent alone. Interestingly, the result set is the same.
The way forward here is either to accept that day10 and OBuilder test different things, or, my preferred solution, to make day10 install both packages in the switch, thereby proving the coinstallable result that OBuilder tests.
The dune alpha, resolved as build hygiene #
ocaml/dune#16617 from last week was closed. The Dune team’s reading is that removing OCAMLPATH from actions improves build hygiene by eliminating dependency ambiguity, and that the failures day10 found are due to misconfigured builds in the respective packages. Shon catalogued hxd, GT and bogue, sent fixes upstream, and bounded their tests to dune < 3.25 in opam-repository.
CI and infrastructure #
Three Apple Silicon macOS workers ZFS issues #
Three of the four arm64 workers had the same kernel panic as on 1st October, zfs: adding existent segment to range tree, after which the kext is evicted and zfs create obuilder/state fails. The recovery was the same as last time: erase the ZFS volume and rebuild.
Homebrew compiles everything now #
Jan noticed ar: libCMakeLib.a: No space left on device on one of the Intel workers. Since Homebrew 7.0.0 in September demoted x86_64 to tier 3, there are no Intel bottles at all, so cmake 4.4.4 was built from source with -flto=thin in /private/tmp. That is the APFS system volume, which is outside of the OBuilder space monitoring.
I cleared the 316 stale source trees across the four Intel workers. ocurrent/macos-infra#62 adds an hourly launchd job that removes Homebrew build directories older than twelve hours, which is safe because the workers run at capacity one, and truncates ocluster.log in place at 128 MB keeping a 32 MB tail.
Ubuntu 26.10 #
Stonking Stingray was released on 15 October. ocaml-dockerfile#276 adds it at tier 2 and moves the Latest alias to it. Stonking Stingray packages OCaml 5.4.1, bubblewrap 0.12.0, gcc 15.3, and still uutils coreutils, so the GNU coreutils swap from 25.10 has been extended to it. Ubuntu 25.04, 25.10 and Fedora 42 are deprecated as past end of life.
Tessera #
17MPU, as shards #
A request came in for MGRS square 17MPU in Ecuador for 2017 through 2025, and after the recent difficulty with the NPY->Zarr conversion, I decided to process it directly into the Zarr store rather than producing NPY tiles first.
The square covers 12 shards, 17:246 to 248 by columns 10 to 13, and the pipeline for it uses mtelvers/ferry again. All the processing was done on monteverde: download the d-pixel data for a shard-year with tessera-dpixel --shard, encode it on the L4, upload it with tessera-zarr-upload, one item per shard-year, 108 items.
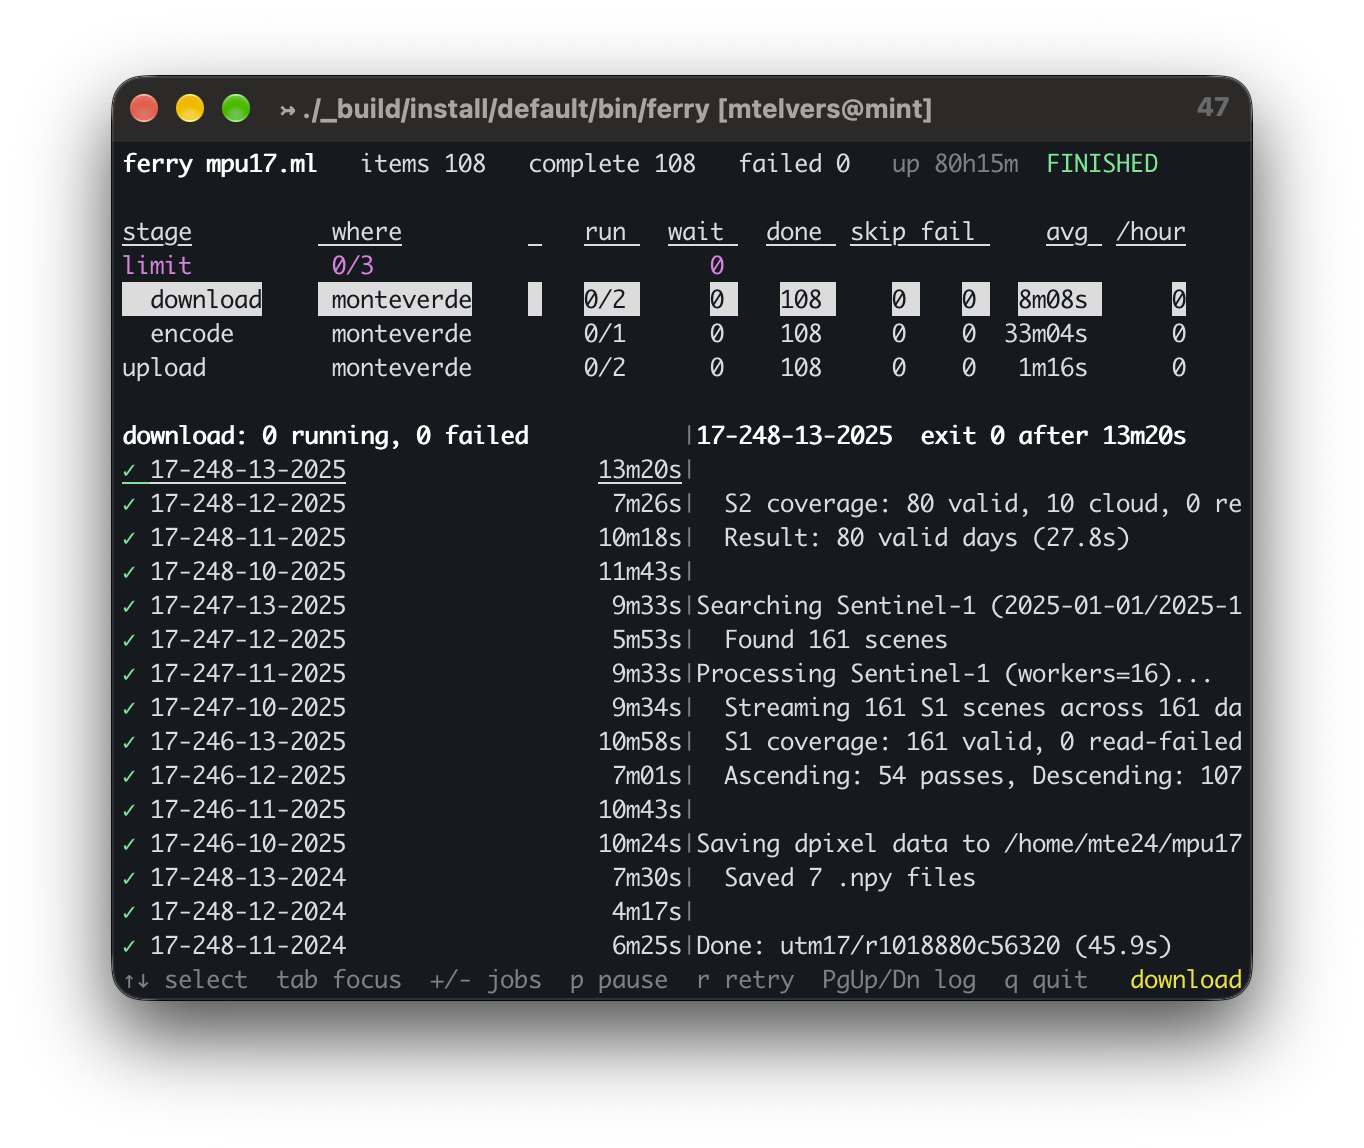 108 shard-years, 0 failures, 80 hours on the clock because I left it running after it finished.
It started at 13:27 on the 22nd and finished at 14:31 on the 24th, 49 hours, with nothing failed. The averages across the run were 8.6 minutes to download a shard-year, 33 minutes to encode it and 76 seconds to upload.
The 9,899 tile downloads on pima averaged about 306 seconds for 828,000 pixels. A shard-year averaged 8.6 minutes for 16.8 million pixels, which is roughly 12 times the throughput per job. A sub-window sits on the zone’s own UTM grid, so the Sentinel-2 granules are plain windowed reads of the COGs, whereas a 0.1-degree tile has to be reprojected for each date.
Twelve full shards instead of a polygon #
The square itself touches 110 of the 192 sub-windows in those 12 shards. The question was whether to process the polygon or the full shards, as writing sub-windows back into the shard later is more work. I decided to process 12 complete shards.
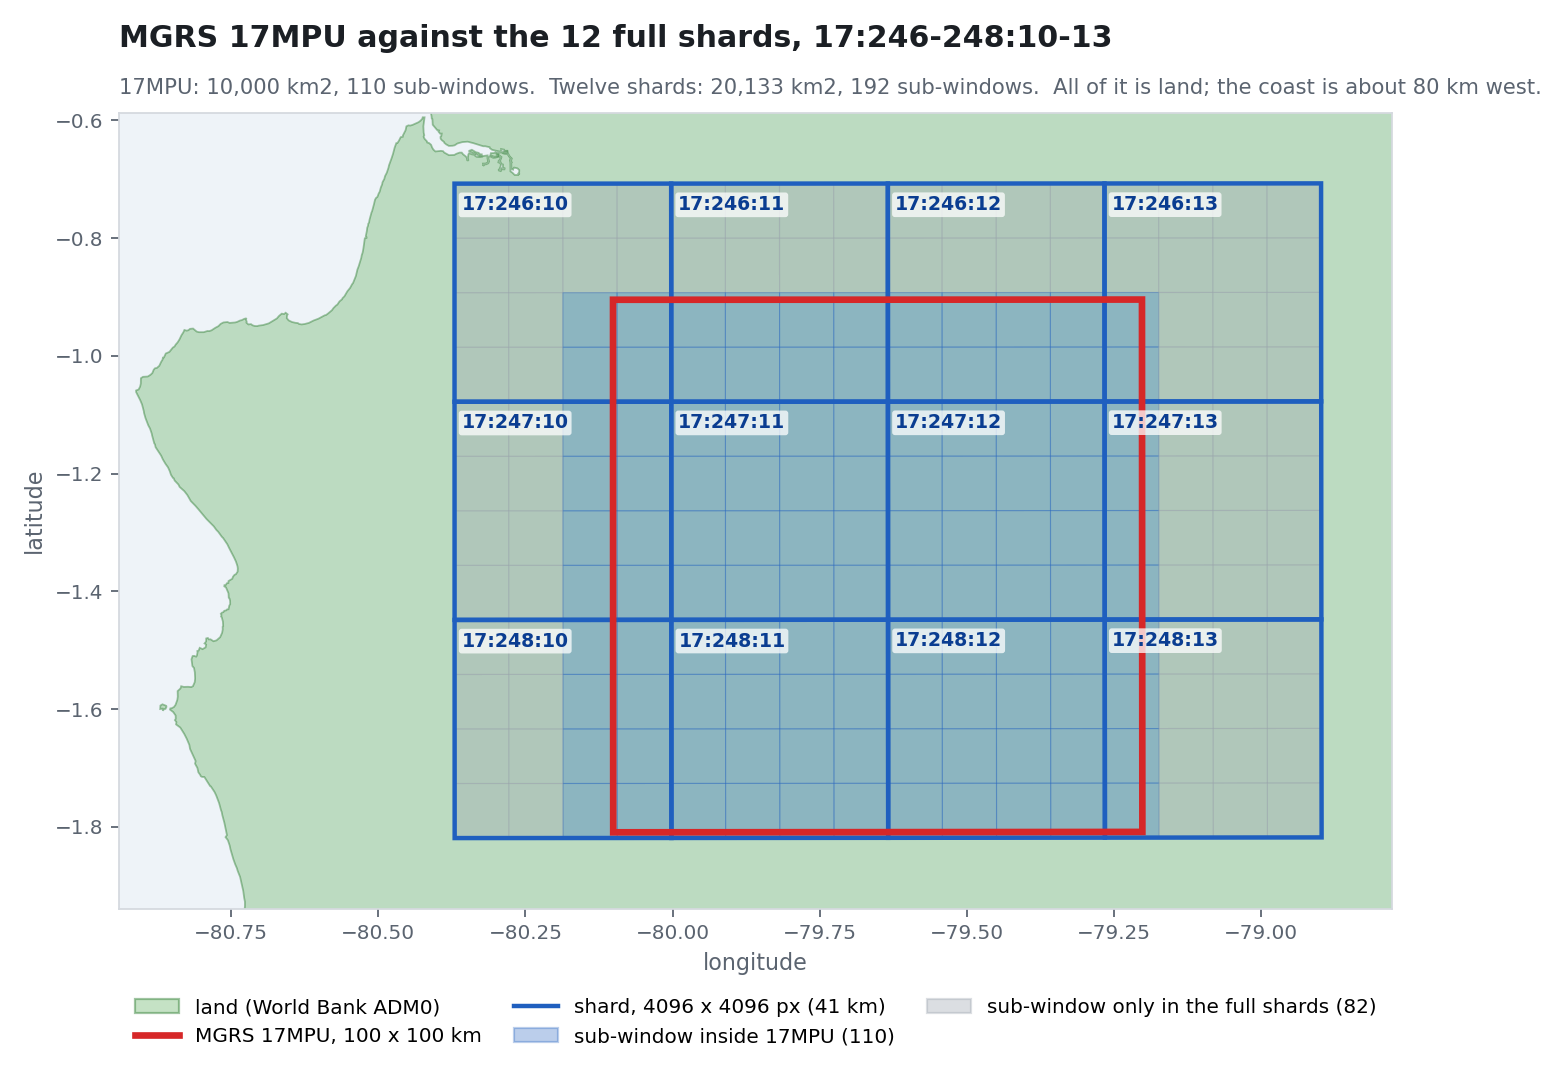 The 100 km MGRS square in red over the twelve 41 km shards in blue. Blue sub-windows are the 110 inside the square; grey are the 82 only in the full shards. The green is Ecuador from the World Bank boundaries, and the coast is 80 km to the west.
The inverse tool #
ucam-eo/geotessera will not give you 0.1-degree NPY tiles from a Zarr store; it exports GeoTIFF and marks the NPY tiles as deprecated. The request wanted tiles. So tessera-zarr-tile has been added to mtelvers/ocaml-tessera-tools and is the inverse of the uploader. A tile is a pure integer window of its centre zone’s grid, because the converter pasted each tile’s axis-aligned UTM bounding box at an integer offset, and the tool reads that window and writes it back in the archive’s layout with the SHA256 sidecar.
Reading a window out of a 1.5 GB shard needed partial reads in mtelvers/ocaml-zarr which was added in commit 6ba7b75. The sharding codec reads the index with a single ranged read from the end of the object, then only the inner chunks that the region touches are coalesced into runs and decoded in parallel, with the S3 store issuing its ranges concurrently.
The code was tested with a round trip. Extracting grid_-1.05_51.05 for 2017 from the store and comparing it with the original NPY before it was converted to Zarr showed 824,106 of 824,900 pixels as identical. Every difference was within 22 pixels of an edge, where geotessera later pasted the neighbouring tile. I extended the testing across other tiles and years for confirmation.
The 17MPU request was then served from the store: 100 tiles per year for each of the nine years were downloaded on daintree at about 15 seconds per tile.
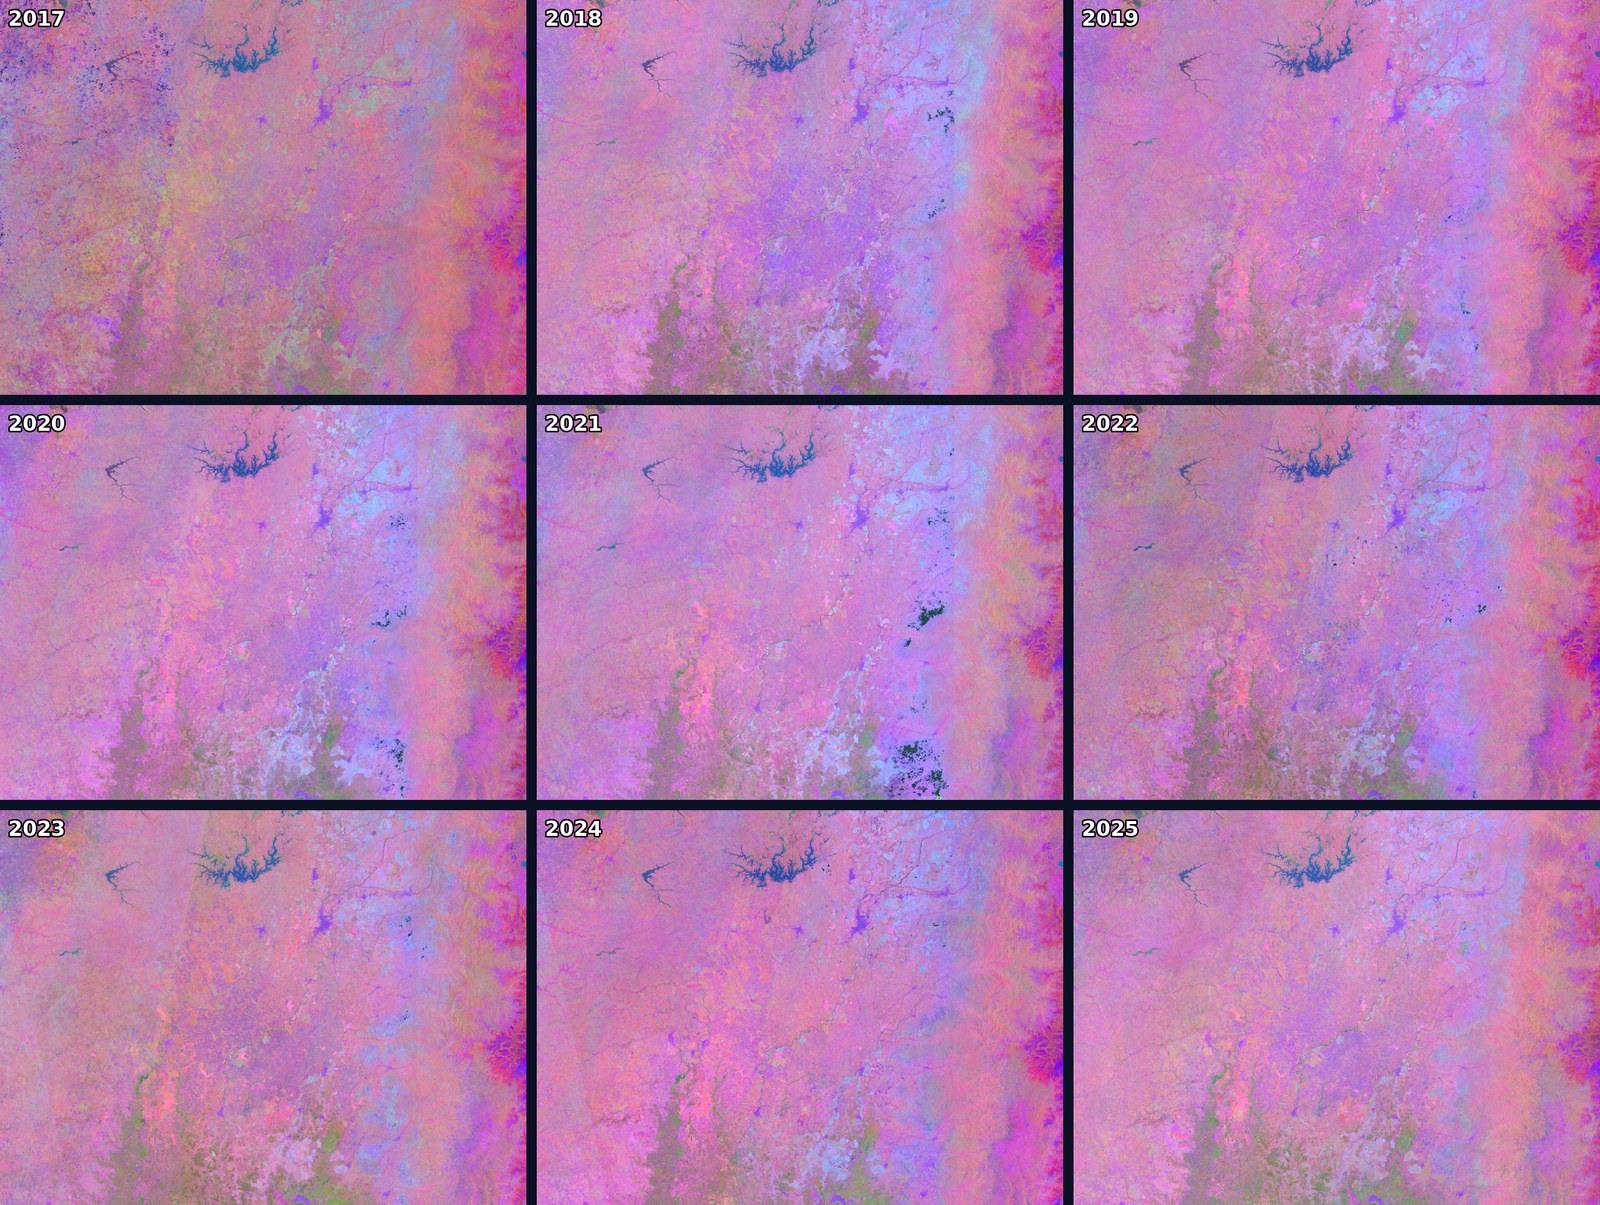 The 12 shards of the 17MPU block, 164 by 123 km of Ecuador, one panel per year. Bands 0 to 2 through the store’s 2024 stretch; the reservoir at the top is the Daule-Peripa.
Cambridge machines #
Files that read as zeros #
James reported four files on /maps that read as zeros. A buffered read of certain 4 MiB objects, the same six indices in all four files, returned zeros, and an O_DIRECT read of the same range returned the data.
To me, this was a critical issue. You need to be able to trust the storage system to return the data you wrote.
So rados get returned the same as O_DIRECT so the data was there. But rados stat showed the affected objects physically short of 4 MiB on the OSDs, by 16 to 48 KiB.
I tried to read the data from another machine, sherwood, and that resulted in the same corruption. I wasn’t expecting this, as much of my investigation had centred on daintree’s memory pressure at the time the files were written. Eventually, I tried another machine, monteverde, and was surprised to find that the files read correctly, but that’s the opening that’s needed in this sort of investigation, as it opens the door to finding the problem.
import os, sys, hashlib

if len(sys.argv) != 2:
    sys.exit(f"usage: {sys.argv[0]} <path-under-cephfs-ec-mount>")

path  = sys.argv[1]
OBJ   = 4 * 1024 * 1024          # CephFS default object_size (= stripe)
SHORT = 16 * 1024                # bytes of stripe-1 we deliberately leave untouched

try: os.unlink(path)
except FileNotFoundError: pass

fd = os.open(path, os.O_CREAT | os.O_WRONLY, 0o644)
os.ftruncate(fd, 2 * OBJ)                            # 2-stripe sparse file
os.pwrite(fd, b'\xaa' *  OBJ,           0)           # stripe 0: full
os.pwrite(fd, b'\xaa' * (OBJ - SHORT),  OBJ)         # stripe 1: last 16 KiB untouched
os.fsync(fd); os.close(fd)

# drop_caches: next read must come from the OSD, not the writer's page cache.
os.system("sudo sync && sudo sh -c 'echo 3 > /proc/sys/vm/drop_caches'")

with open(path, 'rb') as f:
    f.seek(OBJ); buf = f.read(OBJ)
fd = os.open(path, os.O_RDONLY | os.O_DIRECT)
os.lseek(fd, OBJ, 0); direct = os.read(fd, OBJ); os.close(fd)

print(f"BUF stripe-1  nonzero={sum(1 for b in buf    if b):>10,}  "
      f"sha={hashlib.sha256(buf   ).hexdigest()[:16]}")
print(f"DIR stripe-1  nonzero={sum(1 for b in direct if b):>10,}  "
      f"sha={hashlib.sha256(direct).hexdigest()[:16]}")
assert buf == direct, "BUG: buffered read differs from O_DIRECT"
print("OK -- reads agree")
The above code reproduces the problem: create an 8 MiB file, write stripe 0 fully, write stripe 1 short by 16 KiB, sync, drop caches so the next read comes from the OSD rather than the writer’s page cache, and compare a buffered read of stripe 1 with a direct one.
On sherwood: buffered nonzero=0, direct nonzero=4177920. Without the cache drop it passes, which is why a fresh-file test looked fine. Running the same script, on the same pool, across four hosts: sherwood on 6.8.0-142, daintree on 6.8.0-63 and kinabalu on 6.8.0-124 all fail; monteverde on 7.3.0-9 and hopper on 6.5.0-1024-nvidia-64k pass.
It is a Linux kernel bug, not a Ceph one. bugzilla.kernel.org #219237, a regression in the generic netfs read path when a subrequest straddles a remote object shorter than the stripe, introduced with the iov_iter rework and fixed by David Howells in September 2024, first released in 6.12. It needs an erasure-coded data pool, a mid-file object physically shorter than its stripe, and a first read after cache invalidation.
The fix for the three vulnerable hosts is the HWE kernel.
Ceph 19.2.3 to 19.2.6 #
To try to fix the issue above, I upgraded Ceph from 19.2.3 to 19.2.6. The upgrade ran from 07:52 to 18:06. 138 daemons: five monitors, two managers, 86 OSDs, four MDSs.
Clocks out of sync #
While watching the Ceph update, I noticed that daintree’s clock was slow by nearly 5 minutes. Sherwood and monteverde were 34 seconds fast, sequoia 21 behind. All four had systemd-timesyncd enabled and pointed at ntp.ubuntu.com, which cannot be reached from the CL network, and had been silently not syncing. Kinabalu, on chrony, and hopper were within half a second. I copied the local time source, ntp1a to ntp1d.cl.cam.ac.uk, from hopper’s configuration to Chrony on the four hosts. I set no makestep, so nothing jumped.
Other #
The arm32 nightly #
Last week’s note ended with the nightly rebase of the 32-bit backends failing on the Monday morning. The cause was ocaml/ocaml#14980, merged on the 18th, which adds native atomic exchange and compare-and-swap with inline emits for amd64, arm64, riscv and power, and conflicted with the ppc32 changes in the Power emitter. arm32 and i386 have no inline emits for these, so 80ad12a453 routes Catomic_exchange and Catomic_compare_exchange through C on both, the same way caml_atomic_fetch_add already goes, and does them natively on ppc32 with lwarx and stwcx..
That took three more nights to go green. First, the exhaustive match in emit.mlp required that the cases be listed, even though selection never generates them. Then PPC64BE failed because upstream’s configure now requires a C++11 compiler, and the Debian ports worker had no g++. Then it failed again because the freshly installed g++ 16 emits .base64 directives and the worker’s binutils 2.42 does not know them; 2.44 does. Green on the 25th on all four architectures.
Conservation Copilot #
Redeployed the conservationevidencecopilot.com project to its VM to update to the latest code changes.
Endeavour transfer re-test #
Endeavour upgraded their internet connection, so I repeated the transfer test from September: 512 MiB of random data by rsync over ssh. A single stream is 4.7 MB/s, unchanged. Four streams give 11.0 MB/s, and eight give 17.8, still rising, so the cap is per connection rather than the link. In tiles, that is 9 an hour on one stream and 36 on eight, against the 136 an hour one node consumes.